

Today is the day we want to warn our followers that we expect the precious metals to continue to base with a fairly narrow price range for about 45 to 65 more days before upside pricing pressures start to take hold of the markets. There has been quite a bit of chatter about Gold breaking above $1300 recently. Many people have been expecting it to move much higher fairly quickly. We don’t believe that will be the case – but expect it have another significant rally in April, May or June.
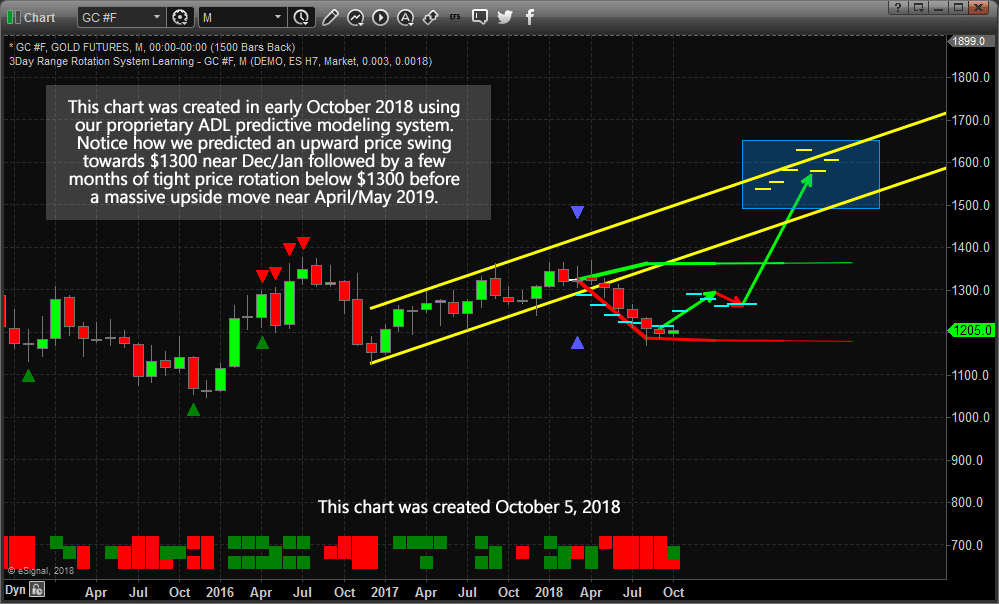
Monthly Gold Forecast Chart – Posted October 2018
Back in early October 2018, we shared this chart with all of our followers suggesting that Gold and precious metals would rally to above $1300 near December/January using our Adaptive Dynamic Learning predictive modeling system. We’ve been suggesting to our followers for many months that Gold, Silver, and miners would begin a new upside price swing, yet we knew the big breakout moves were still many months away.
Pay very close attention to the DASH lines on the chart and the GREEN and RED arrows we drew to help our followers understand what we expected to see happen in the future.
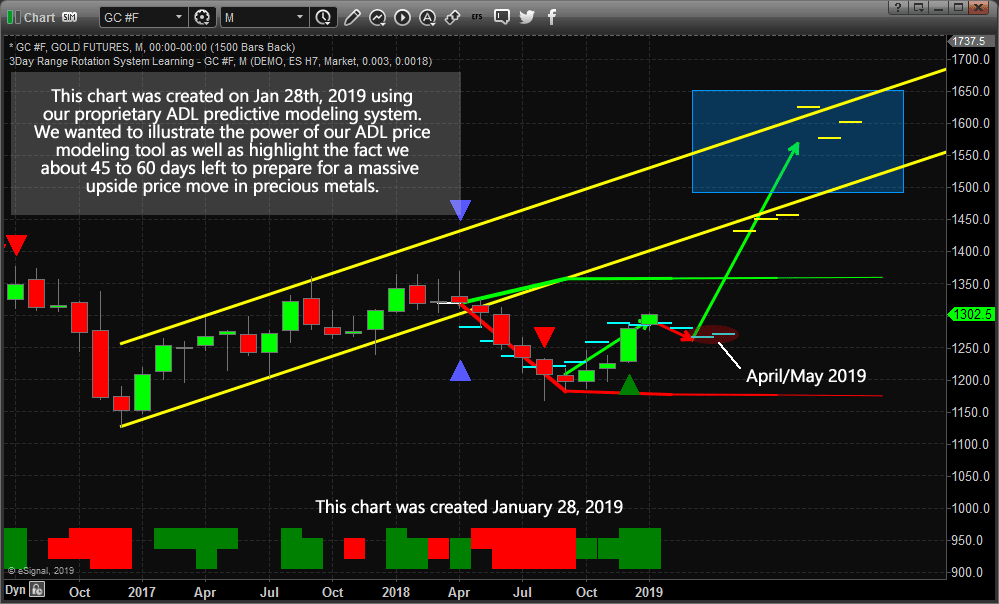
Todays Updated Monthly Gold Chart
Now, take a look at the current Gold chart below with the same ADL levels displayed on it. Notice how price moved towards the DASHED lines almost perfectly in alignment with our predictive modeling results? Yes, the move in December was a bigger upside swing compared to the previous few months, but that is what happens when a “price anomaly” sets up with the ADL system. When the price falls “out of alignment” with the ADL predictions, we call this a “price anomaly”. This is when the price may quickly rally or sell-off, depending on the direction of the anomaly, to attempt to catch up to the mathematically predicted price levels.
Currently, we expect the price of Gold to stay between $1250 and $1320 for the next few months while it consolidates towards the $1260~1275 range near early April or early May 2019. And that will be all she wrote, folks. Because once price settles near this level near the April/May timeline, this should be the basing formation that will launch massive new momentum to the upside. Our opinion is that it would be best NOT to wait till the last minute to prepare for this move. Even though we expect this move to start near April/May of 2019, it could start to melt-up earlier than we expect – this is why we are warning you today that we have about 45 days left to plan and prepare for this trade. Subscribers entered a long GDXJ position down near the lows at $27.52 a while back slowly preparing for this major market bottom.
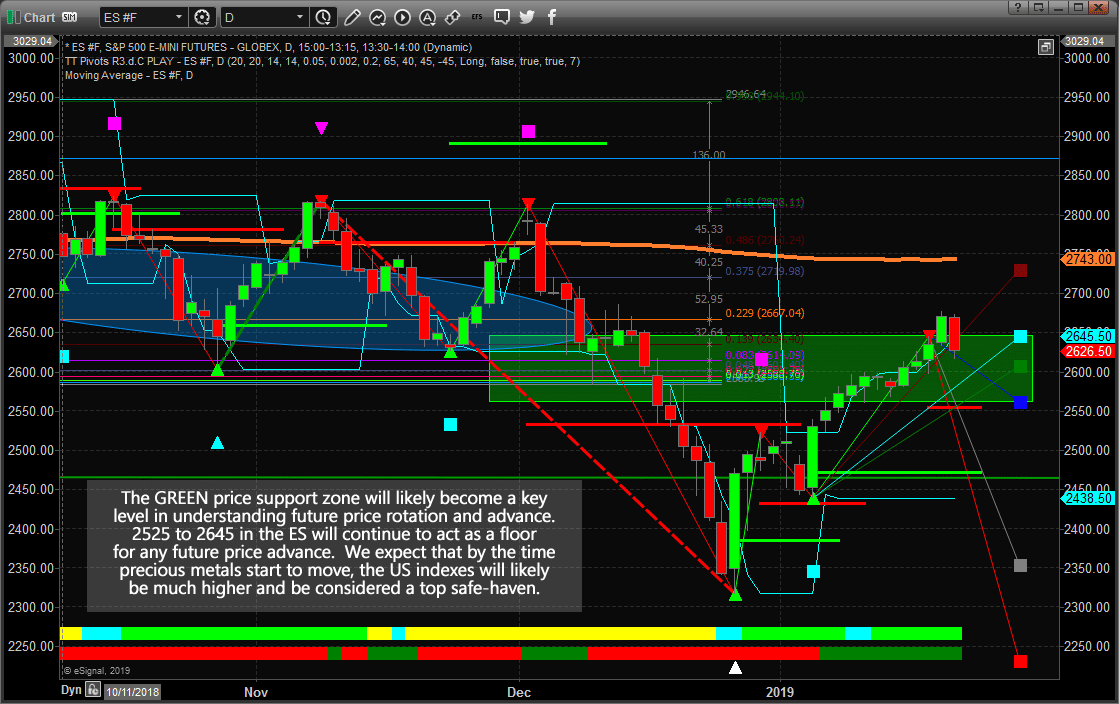
Daily SP500 Index Chart
If our analysis is correct, the US markets will settle into a melt-up format where global capital continues to pour into the US stock market in an attempt to avoid risks associated with global market slowdowns and events. This “capital shift” will continue to play out for the first 2 quarter of 2019 without much interruption. Our ADL predictive modeling system is suggesting that by May/June of 2019, precious metals should start to rally above $1400 and that means something is going to cause fear in the markets. It could be the US Presidential election cycle spinning up or it could be something external – we don’t know yet. We do know that the Brexit date, March 29, 2019, is likely to spark some renewed fears in the global markets and we are eagerly watching the news cycles to see what is next.
The current support levels in the ES is between 2525 and 2645. We recently posted a public article sharing our research regarding our opinion that rotation near 2670 was likely and that the GREEN support zone should act as a floor for current price rotation. Our Fibonacci price modeling system is suggesting there is a vast array of support in this zone where the price should base, build power and begin a continued upside “melt-up” over the next 60~90+ days.
Why is it important to understand that this stock market may continue to rally as Gold and precious metals begin a breakout upside move? It is important to understand how fear rotates through the markets as a result of “origin”. The origin of the event or crisis that is generating this fear in the markets tends to shift perception as to the extent this fear/event will reach other economies. With the 2008-09 credit market crisis, the origin was the US and global financial institutions – the biggest institutions on the planet. We believe the new crisis event may be “regional” to Asia/China and Europe. Thus, the origins and reach of these events may be more isolated than last time.
Also, we know that the once leaders of a market (tech) become the dogs, and the unwanted assets become market leaders. Commodity/resource stocks (precious metals) tend to outperform the USA stock market in the final few months before the bull market ends and that could be what is happening right now. Tech stocks are lagging while the precious metals sector is one of the strongest.
We believe 2019 is going to be the year where skilled traders can make a fortune if you know what you are doing and can see these moves in advance. Our team of traders and researchers at www.TheTechnicalTraders.com are dedicated to helping you find and execute better trades. Visit our web site and see how we can help you build for a greater future. I will drop one little hint before the news hits the wires, we are building a new client services portal that will blow your minds in terms of ease of live intraday analysis, trading opportunities from day trading, to swing trades, and even our own long term investment signals). This new client portal will allow you to more actively engage with our team and fellow traders of our service. Get started now as we are only a few weeks away from launching these new member tools.
Chris Vermeulen