Source: Clive Maund for Streetwise Reports 01/13/2020
Technical analyst Clive Maund examines the effects of recent geopolitical events on the precious metals markets.
It has been a week of surprises since the last updates were posted. First, I had not expected Iran to retaliate following the murder of its top general by a U.S. drone—but it did, despite the risks, as it was politically necessary to assuage the extreme anger of its population who demanded revenge.
The next surprise was that Israel and the U.S. did not use this retaliation as an excuse to bomb Iran back to the Stone Age, which is what they really want to do. As we know, the long-term goal of Israel and the U.S. is to subjugate Iran, and they will not stop until they attain this goal.
And so it goes on. It appears that there was a bit of theater involved in Iran’s retaliation, as it clandestinely signaled its intentions which allowed U.S. forces to get out of harm’s way. Perhaps U.S. forces did not then launch a blitzkrieg out of consideration for this courtesy.
Regardless of the muddled and unpredictable fundamental situation, which included the accidental downing of a passenger plane by Iranian defensive missile batteries, the charts allowed us to make a reasonably accurate prediction regarding what was likely to happen to the gold price. The call for a near-term top in the precious metals (PM) sector made on the site on Monday looked incorrect the following evening, when gold suddenly surged about $35 on news of the retaliatory Iranian missile strike. But when it later became apparent that there were, strangely, no U.S. troop casualties and no further action against Iran, gold and silver reversed dramatically and dropped quite hard, as the tension then looked set to ease, at least over the short-term.
Technically what happened is that gold pushed quite deep into heavy overhead resistance, becoming very overbought at a time when COTs were showing extreme readings, and was thus vulnerable to a sudden reversal. The action around this time illustrates an important point, which is that when gold rises due to sudden geopolitical developments, the gains tend not to stick.
What really matters, and is the big driver for gold at this time, is the insane monetary expansion that is going on, which is being undertaken in a desperate attempt to postpone the systemic implosion that is baked in for as long as possible. As we have already observed in these updates in recent weeks, gold is already in a raging bull market against a wide variety of currencies, and it won’t be all that long before it’s in a raging bull market against the dollar too, as the Fed sets the stage for hyperinflation.
There are two big and compelling reasons for the U.S. government to tank the dollar. One is that it makes U.S. exporters more competitive, and the other is that it can use the mechanism of inflation to wipe clean its colossal debts by paying them off in devalued coin, printing vast amounts of money to pay them off, and in the process legally swindling the foolish creditors out of their dues.
This is precisely what the Weimar Republic in Germany did in 1923 to eliminate the unfair reparations imposed by the Treaty of Versailles, which were unfair also because Germany didn’t start the First World War—it was tricked into it by the Allies, because the British Empire was scared of Germany’s rising industrial and military might and wanted to destroy it. . .100-plus years of propaganda lies about Germany being responsible for the First World War notwithstanding.
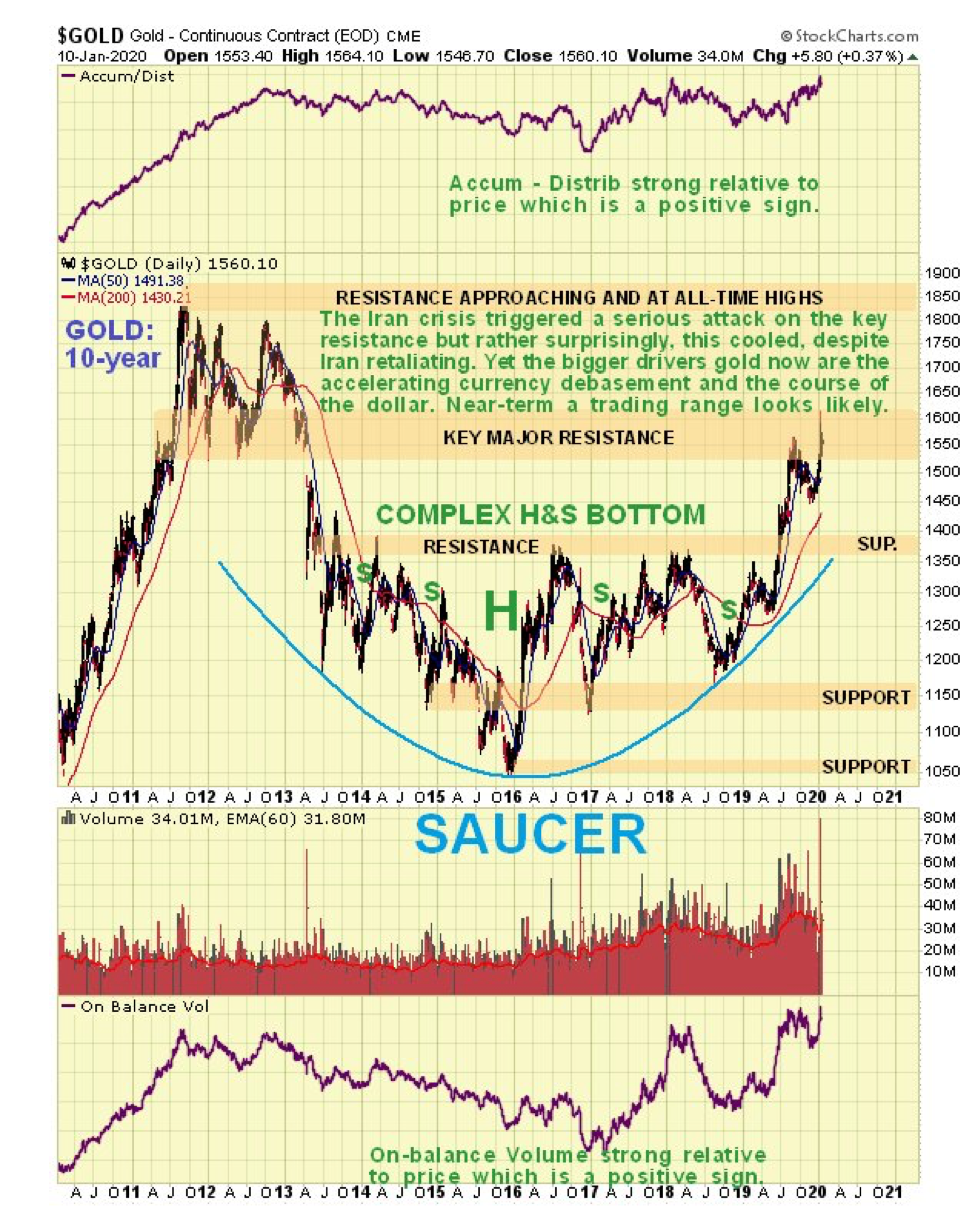
We’ll look at the dollar a little later. First we will review gold’s charts, starting with the 10-year chart.
On the 10-year chart we see that gold is now a bull market, even against the dollar, and is currently challenging the heavy resistance arising from the 2011–2013 top area. The second attack on this resistance in the space of few months got further because of the Iran crisis. If this cools any more short term, it will probably lead to gold settling into a trading range before it mounts a more successful attack on this resistance.
A point to note here is that while the resistance up to the 2011 highs, in the $1,800 area, looks like a major obstacle, it’s not such a big deal as many think, given the rate at which the dollar is now being debased.
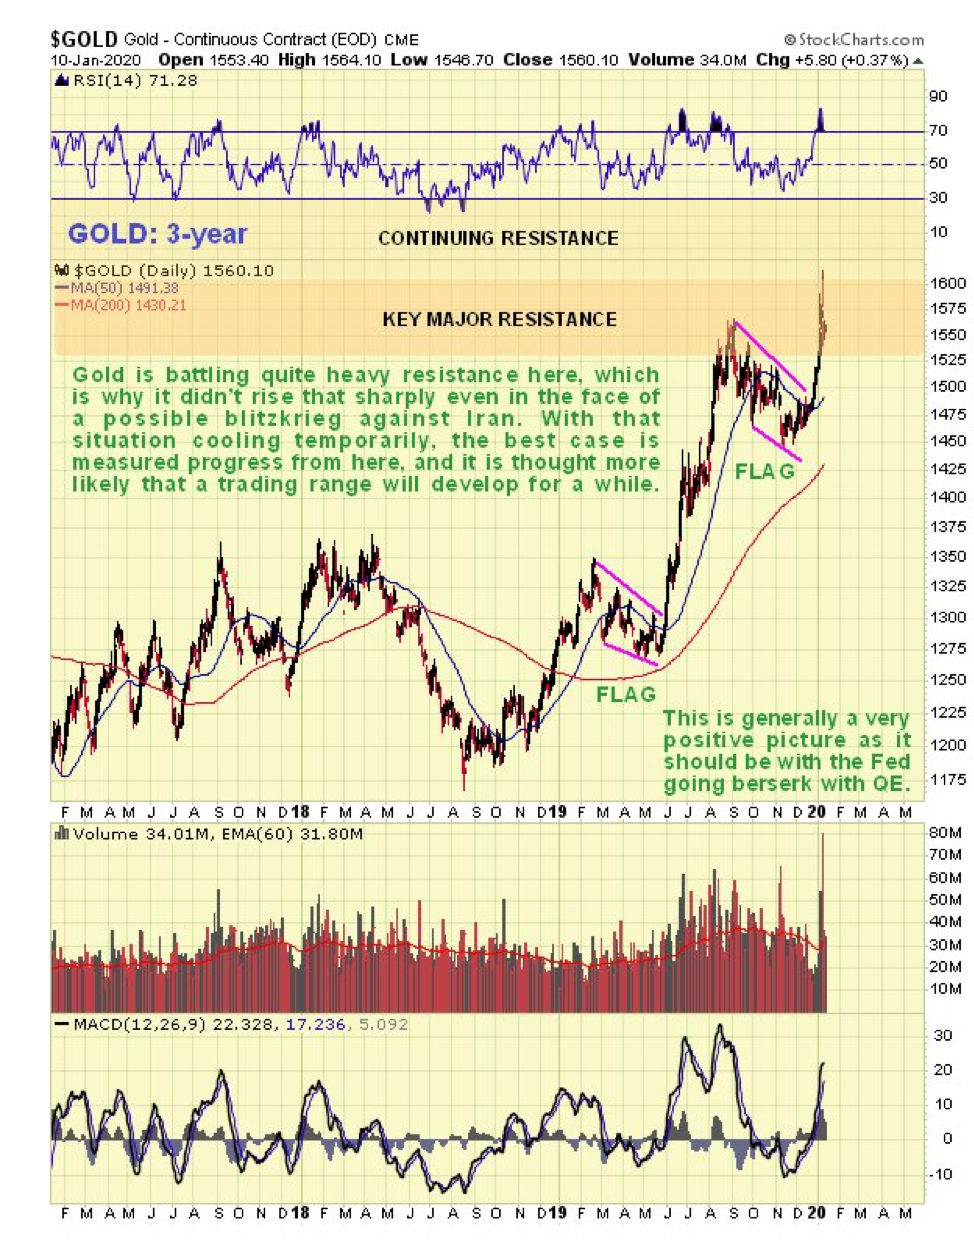
This week it’s worth also taking a quick look at a 3-year chart for added perspective. This chart shows us that since the bull market started in midsummer, we have seen three sharp run-ups punctuated by two bull flags. While the second of these flags targets the $1,800 area, we have to factor in that gold now has much more overhanging supply to contend with than on the first run-up. This, coupled with quite extreme COT readings, inclines to the view that this will need to be worked off. Hence, the interpretation that it will probably need to consolidate for a while before it makes significant further progress—although it obviously won’t if the U.S. starts a serious bombing campaign against Iran. The Fed’s increasingly manic money printing will eventually drive it higher, of course.
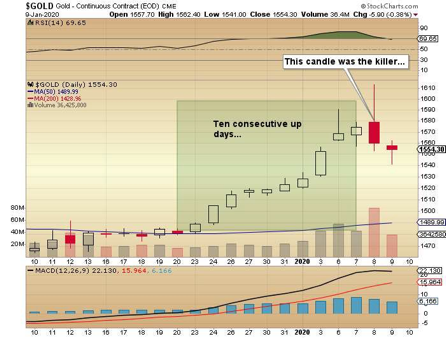
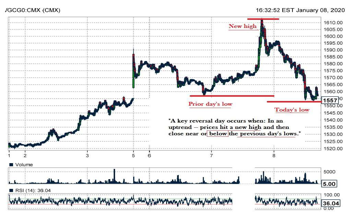
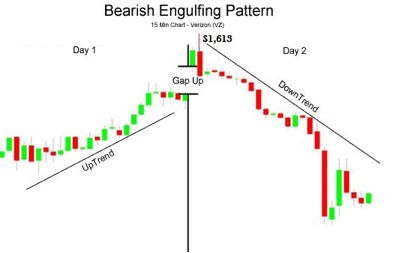
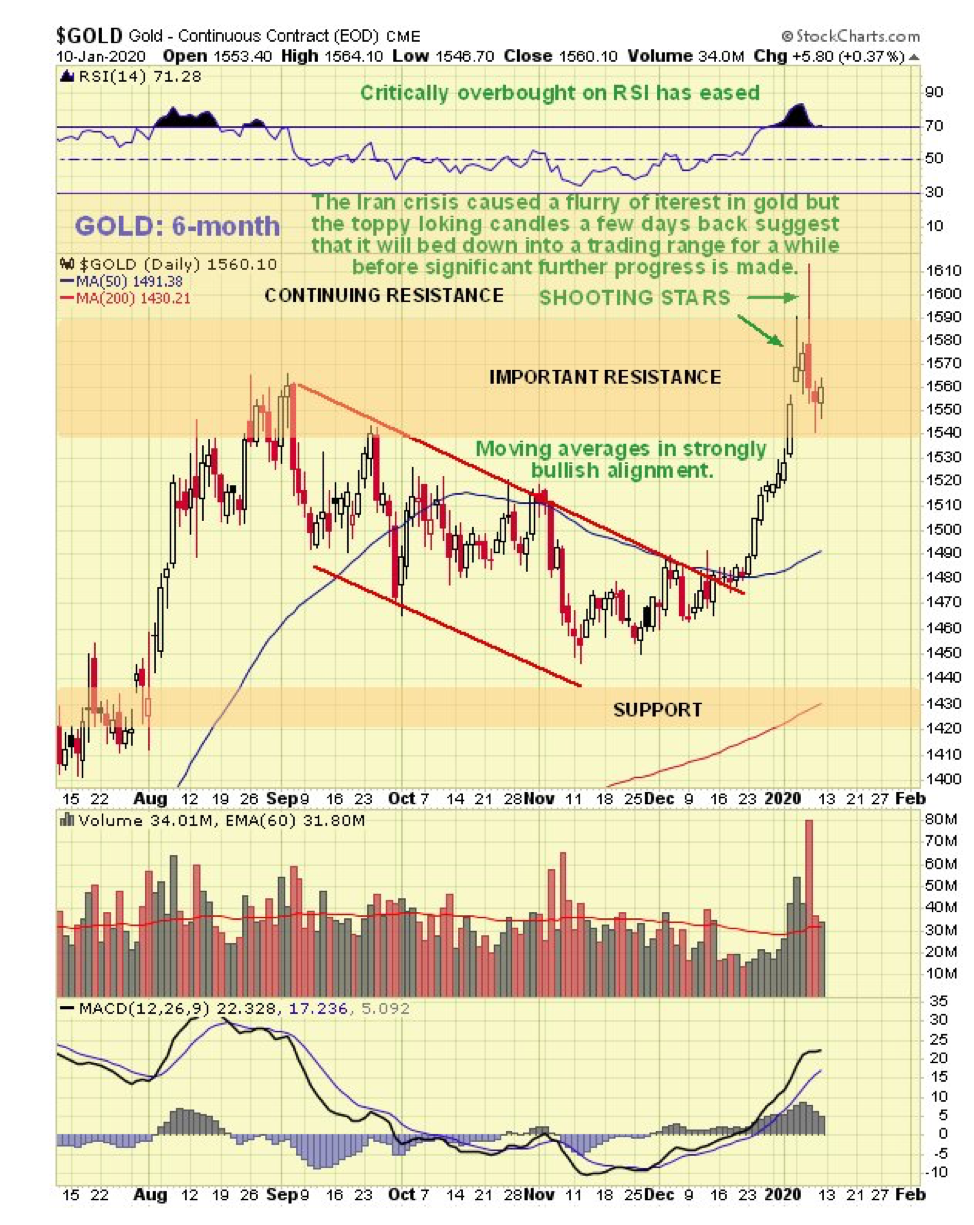
On the 6-month chart we can see the interesting price action around the Iran crisis over the past week or so. A bearish “shooting star” appeared on the chart last Monday, which we took as a sign that gold was forming a short-term top. But then, overnight on Jan. 7–8, it surged briefly above $1,610—when Iran lobbed missiles at U.S. bases in Iraq—which had many concluding, not unnaturally that this would trigger a major Israel–US bombing campaign.
When it became apparent that there were no casualties from the Iranian attack and no U.S. counter-strike, tensions quickly cooled, and gold lost ground fast the next day, putting in a big high-volume reversal candle, approximating to another shooting star. Normally such action is followed by a retreat, at least for a while, and some stocks, like silver stock Coeur Mining Inc. (CDE:NYSE), which we ditched a while ago, got clobbered. This is why gold is expected to settle down into a trading range for a while, before mounting another attack on the resistance.
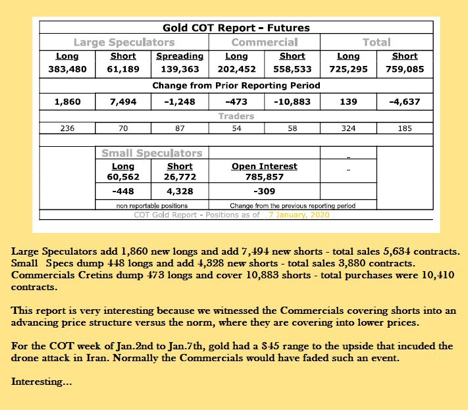
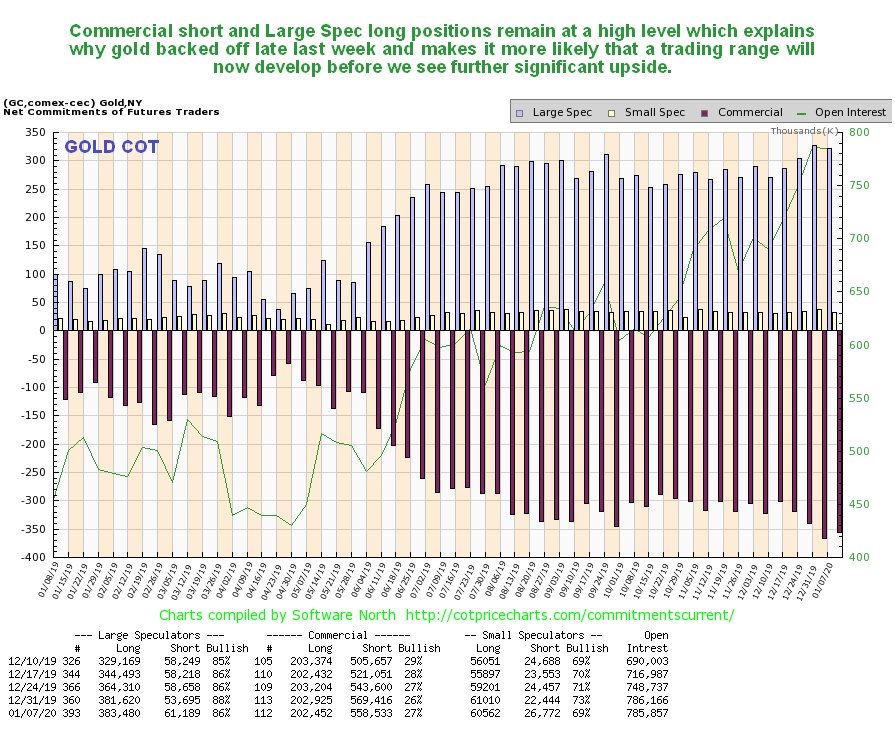
Another factor suggesting that gold will consolidate/react back for a while is the latest COT, which shows still very high Commercial short and Large Spec long positions.
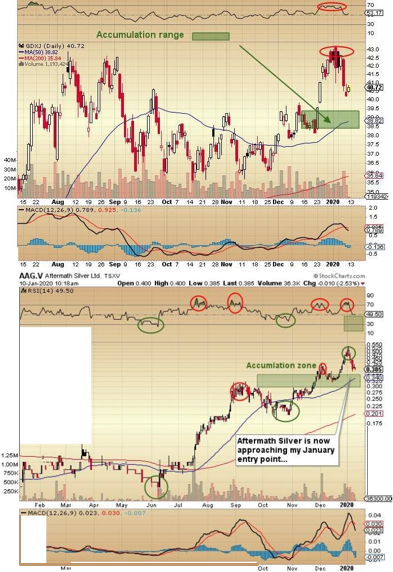
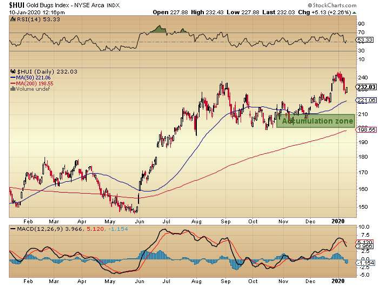
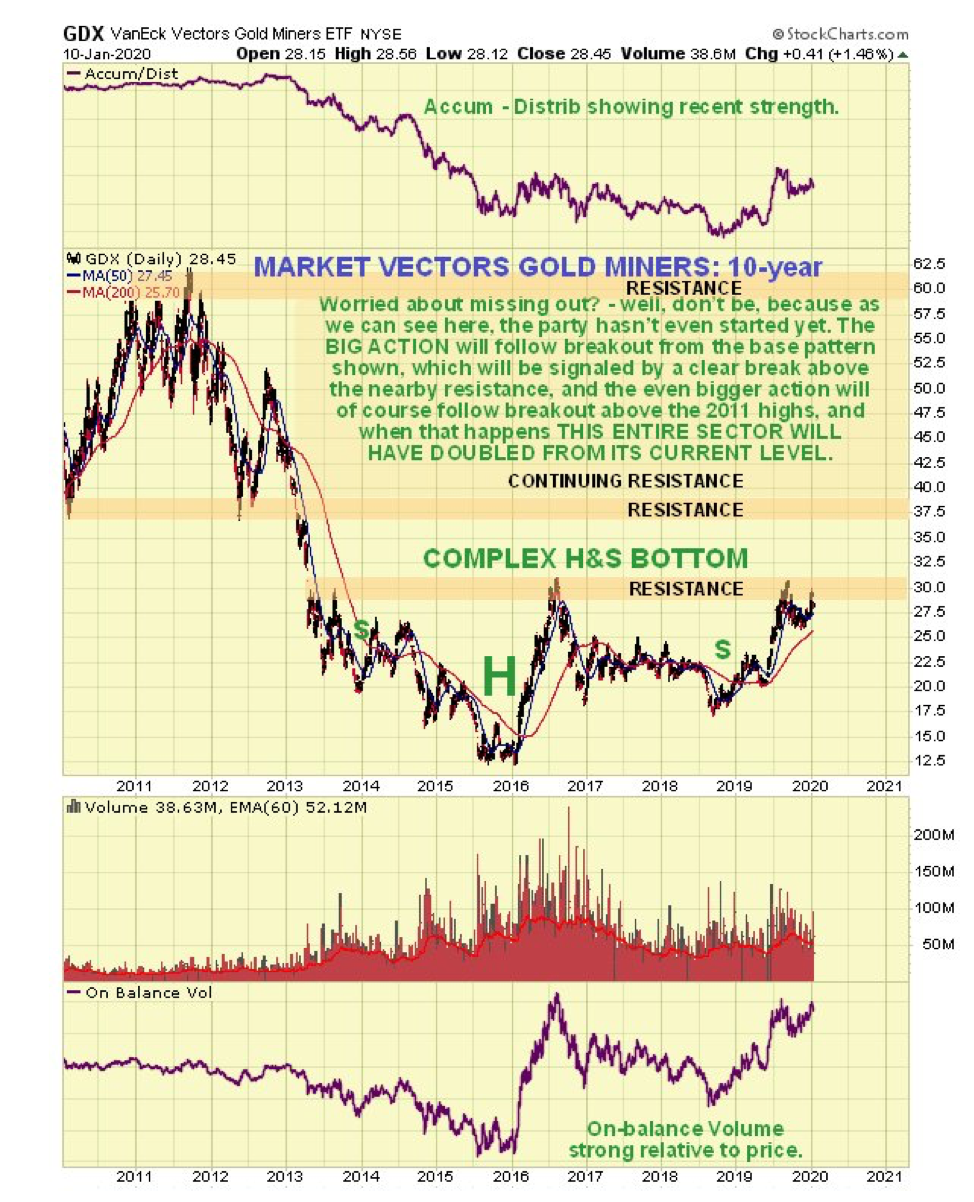
What about precious metals stocks? The latest 10-year chart for GDX shows that we still have most everything to look forward to. Despite the rally from the middle of last year, it still hasn’t broken out of the giant complex head-and-shoulders bottom that has formed since way back early in 2013. A breakout above the nearby resistance should lead to a rapid ascent to the next resistance level at the underside of a large top pattern, and thereafter it will have to work its way through continuing resistance up to its highs. The strength of the volume indicators in the recent past are a sign that it “means business.”
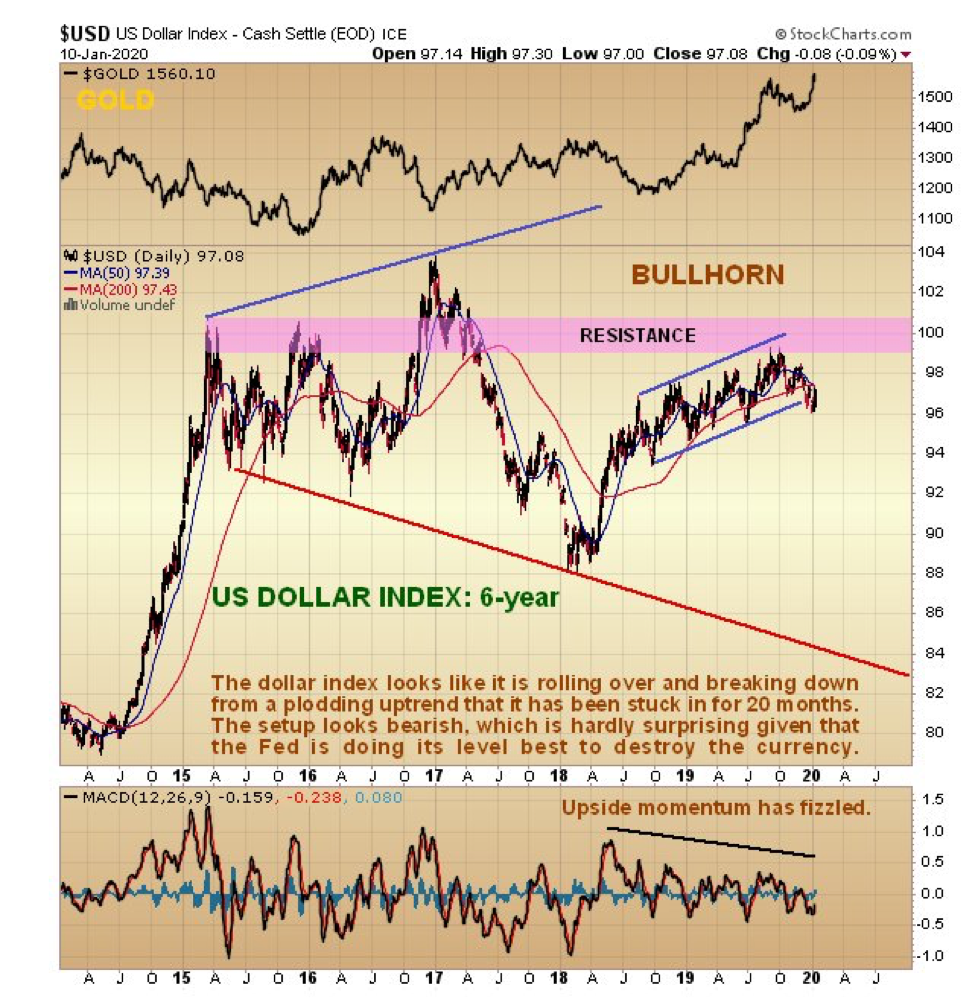
Now we turn our attention to the dollar, which is looking increasingly frail, as we can see on the latest 6-year chart for the dollar index. It is rolling over beneath resistance and appears to be breaking down from the 16-month gentle uptrend shown.
This is, of course, the main reason that gold, shown at the top of this chart, has been breaking higher again. If it fails to hold up here it could be targeting the lower boundary of the bullhorn pattern, which would involve a heavy drop from the current level that would “light a fire” under the precious metals, and many other commodities, notably copper.
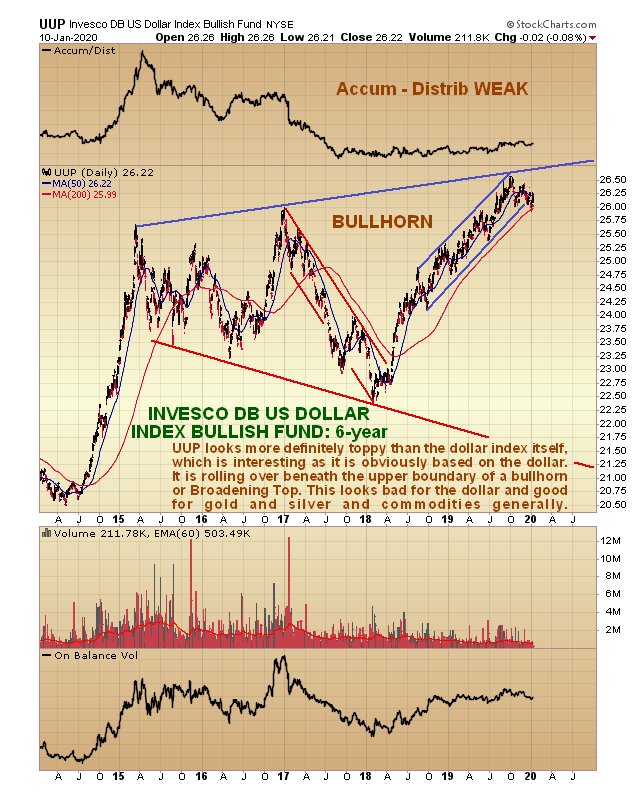
A chart that really gives the game away and calls time on the dollar is the 6-year chart for dollar proxy UUP. As we can see, unlike the dollar index itself, this has risen up to the upper boundary of its giant bullhorn pattern, and appears to be on the point of breaking down. Its accumulation line has been very weak. This chart suggests that the dollar could be in for a very rough ride before long, which is hardly surprising considering the lengths to which the Federal Reserve is going to destroy it. While other countries and trading blocs, most notably the European Union (EU), are making a valiant attempt to destroy their own currencies, they will be hard put to keep up with the Fed.
And now, for the benefit of anyone who still doubts that gold is in a bull market, I have pleasure in presenting the following 6-year chart for gold against the Japanese yen.
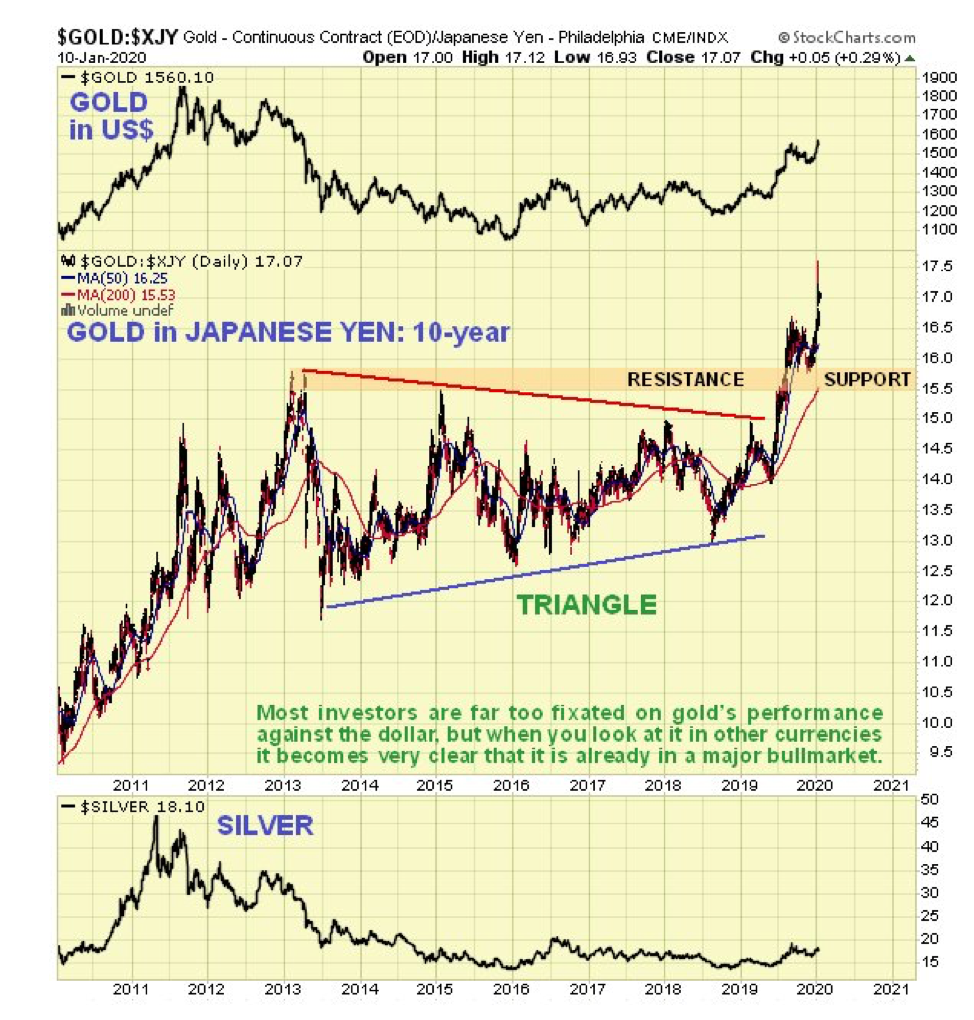
Still think gold might be in bear market? No—didn’t think you would.
It’s always good to end on a positive note, and we’ll do so by looking at a stock with a supremely bullish setup, which we happened to buy right before it broke out about a week ago. It may well have been our buying that triggered the breakout.
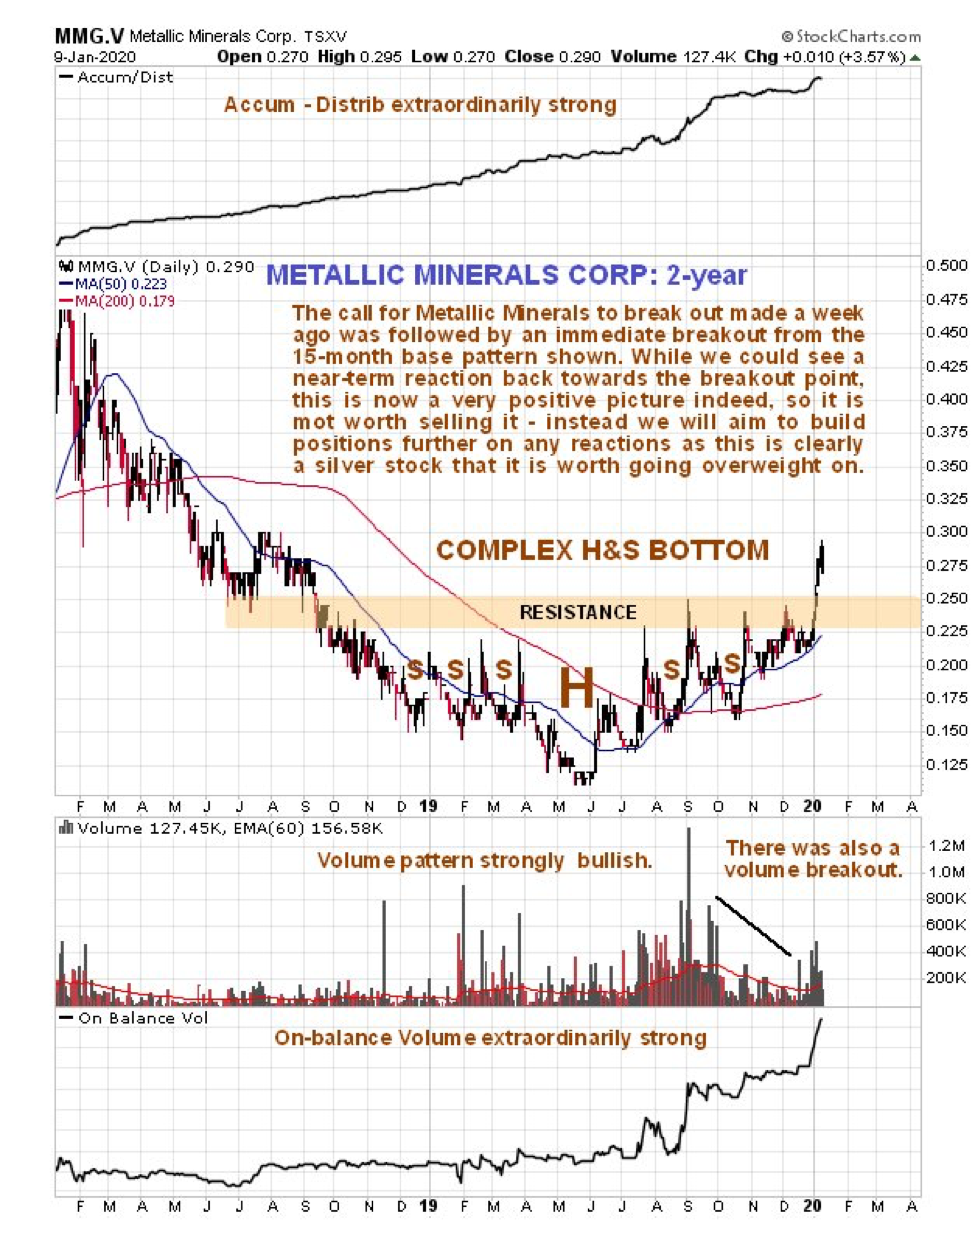
Although you can never be 100% sure of anything with these smaller issues, I am sure that you will agree with me that this chart is not suggestive of a sector that is going anywhere but up.
Conclusion
Although last week’s reversal candle and the current rather extreme COT structure mean that gold may react back more near term, the overall picture is strongly bullish, which is hardly surprising as the fiat money system is fast approaching its nemesis, with the line of least resistance leading to hyperinflation. Our general approach, therefore, is not to sell PM sector investments, except on a case-by-case basis where they become critically overbought, but instead to buy or add to positions on dips.
Article originally published on CliveMaund.com on Sunday, Jan. 12, 2020.
Clive Maund has been president of www.clivemaund.com, a successful resource sector website, since its inception in 2003. He has 30 years’ experience in technical analysis and has worked for banks, commodity brokers and stockbrokers in the City of London. He holds a Diploma in Technical Analysis from the UK Society of Technical Analysts.
Sign up for our FREE newsletter at: www.streetwisereports.com/get-news
Disclosure:
1) Clive Maund: I, or members of my immediate household or family, own shares of the following companies mentioned in this article: None. I personally am, or members of my immediate household or family are, paid by the following companies mentioned in this article: None. My company has a financial relationship with the following companies mentioned in this article: None. CliveMaund.com disclosures below. I determined which companies would be included in this article based on my research and understanding of the sector.
2) The following companies mentioned in this article are billboard sponsors of Streetwise Reports: Metallic Minerals. Click here for important disclosures about sponsor fees. As of the date of this article, an affiliate of Streetwise Reports has a consulting relationship with Metallic Minerals. Please click here for more information.
3) Statements and opinions expressed are the opinions of the author and not of Streetwise Reports or its officers. The author is wholly responsible for the validity of the statements. The author was not paid by Streetwise Reports for this article. Streetwise Reports was not paid by the author to publish or syndicate this article. The information provided above is for informational purposes only and is not a recommendation to buy or sell any security. Streetwise Reports requires contributing authors to disclose any shareholdings in, or economic relationships with, companies that they write about. Streetwise Reports relies upon the authors to accurately provide this information and Streetwise Reports has no means of verifying its accuracy.
4) This article does not constitute investment advice. Each reader is encouraged to consult with his or her individual financial professional and any action a reader takes as a result of information presented here is his or her own responsibility. By opening this page, each reader accepts and agrees to Streetwise Reports’ terms of use and full legal disclaimer. This article is not a solicitation for investment. Streetwise Reports does not render general or specific investment advice and the information on Streetwise Reports should not be considered a recommendation to buy or sell any security. Streetwise Reports does not endorse or recommend the business, products, services or securities of any company mentioned on Streetwise Reports.
5) From time to time, Streetwise Reports LLC and its directors, officers, employees or members of their families, as well as persons interviewed for articles and interviews on the site, may have a long or short position in securities mentioned. Directors, officers, employees or members of their immediate families are prohibited from making purchases and/or sales of those securities in the open market or otherwise from the time of the interview or the decision to write an article until three business days after the publication of the interview or article. The foregoing prohibition does not apply to articles that in substance only restate previously published company releases. As of the date of this article, officers and/or employees of Streetwise Reports LLC (including members of their household) own securities of Metallic Minerals and Coeur Mining, companies mentioned in this article.
Charts provided by the author.
CliveMaund.com Disclosure:
The above represents the opinion and analysis of Mr Maund, based on data available to him, at the time of writing. Mr. Maund’s opinions are his own, and are not a recommendation or an offer to buy or sell securities. Mr. Maund is an independent analyst who receives no compensation of any kind from any groups, individuals or corporations mentioned in his reports. As trading and investing in any financial markets may involve serious risk of loss, Mr. Maund recommends that you consult with a qualified investment advisor, one licensed by appropriate regulatory agencies in your legal jurisdiction and do your own due diligence and research when making any kind of a transaction with financial ramifications. Although a qualified and experienced stock market analyst, Clive Maund is not a Registered Securities Advisor. Therefore Mr. Maund’s opinions on the market and stocks can only be construed as a solicitation to buy and sell securities when they are subject to the prior approval and endorsement of a Registered Securities Advisor operating in accordance with the appropriate regulations in your area of jurisdiction.


( Companies Mentioned: MMG:TSX.V; MMNGF:OTCMKTS,
)