
By Cory댊
2 Charts Worth Noting – A Key Juncture For Gold, S&P Topping?
Below are 2 very interesting charts presented by our friend Chris Kimble. The first chart is comparing some of the recent price and momentum action in the S&P to the tops of 2000 and 2007. The second chart is a key juncture for gold vs USD. If it fails to hold we could be in for a much longer bear market.
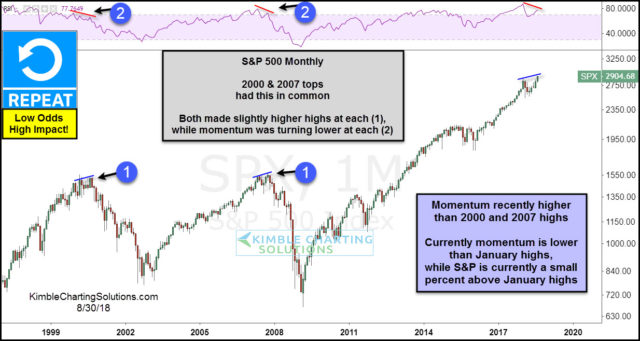
Chart 1
CLICK ON CHART TO ENLARGE
Did the topping patterns in 2000 & 2007 have anything in common? Yes! While the S&P was hitting nominal new highs in 2000 & 2007 at each (1), monthly momentum was actually heading lower at each (2).
Of late the S&P is hitting new highs, while monthly which was recently higher than the 2000 & 2007 peaks has been turning lower.
Chart 2
CLICK ON CHART TO ENLARGE
This chart looks at the US Dollar/Gold ratio on a monthly basis over the past 25-years. When the ratio peaked back in 2000/2001 the great bull run for Gold and Silver got started. The bull run for metals continued until the ratio bottomed back in 2011, at the bottom of falling channel (A).
After hitting support in 2011, the ratio started heading higher, creating the rising channel (1). The 7-year rally in this ratio and 7-year bear market in metals is experiencing a monster important price point this month at (2).
The ratio is testing the top of 17-year falling channel (A), which comes into play as resistance at this time. As the month is coming to a close, the ratio could be creating a bearish reversal pattern (bearish wick) at (2).
Metals bulls need and would LOVE to see the ratio peaking at (2). If it does peak and heads lower, it could reflect that the end of the 7-year bear market for metals could be forming.
Click here for the full posting.
From:: The Korelin Economic Report