
Source: Clive Maund for Streetwise Reports 07/24/2018
Technical analyst Clive Maund provides copper, gold, platinum, silver and US dollar updates at what he calls a “key juncture.”
Commodities, including gold and silver, have plunged to become so deeply oversold that a snapback rally looks likely soon. This could be sharp and could trigger a wave of short covering. Such a rally is likely to be sparked by a dollar reaction, as we will see, but it is likely to be followed by further heavy losses across the sector if a general market crash ensues as expected.
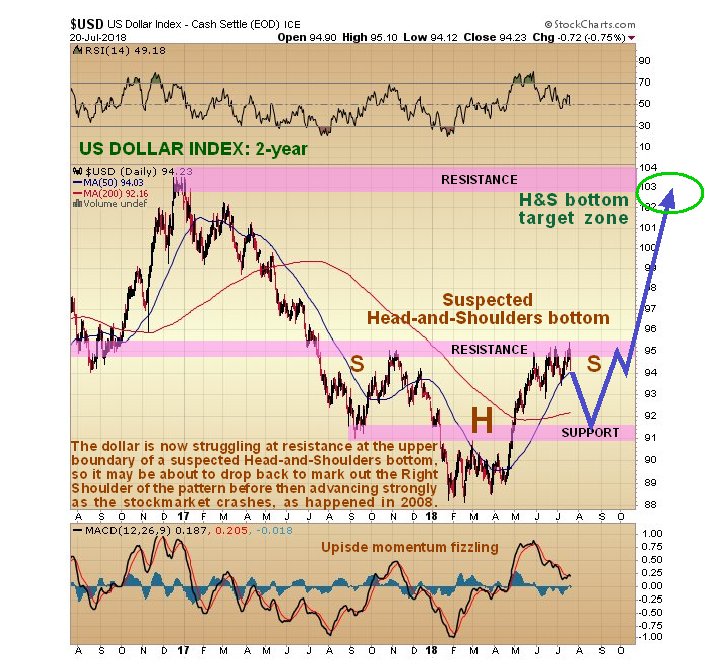
We will start by looking at the latest dollar index chart, as a dollar reaction will be what ignites a commodity rally. The 2-year chart for the dollar index shows that the dollar is rounding over beneath a zone of resistance that dates back to a reversal that occurred at this level last October and November. The pattern that has formed from last July looks like a large head-and-shoulders bottom, with the right shoulder of the pattern about to form.
If this is what it is, it implies that the dollar will in due course go considerably higher to the 102–104 area, which we can expect to happen during the market crash phase. But first there is the little matter of the right shoulder forming to balance the pattern, and if a more or less symmetrical right shoulder forms, then we are looking at the dollar dropping to the 91–92 zone over the near term, which will be sufficient to generate a significant snapback rally in commodities—which, as mentioned above, is likely to be magnified by short covering. That is the theory that I have and which is mine and what it is too.
So now, let’s proceed to review the charts of a range of important commodities: copper, gold, silver and platinum, which will give us more of an idea regarding how likely it is that they will soon rally. The 1-year charts are selected to enable us to relate them directly to the COT charts, which are also for 1-year.
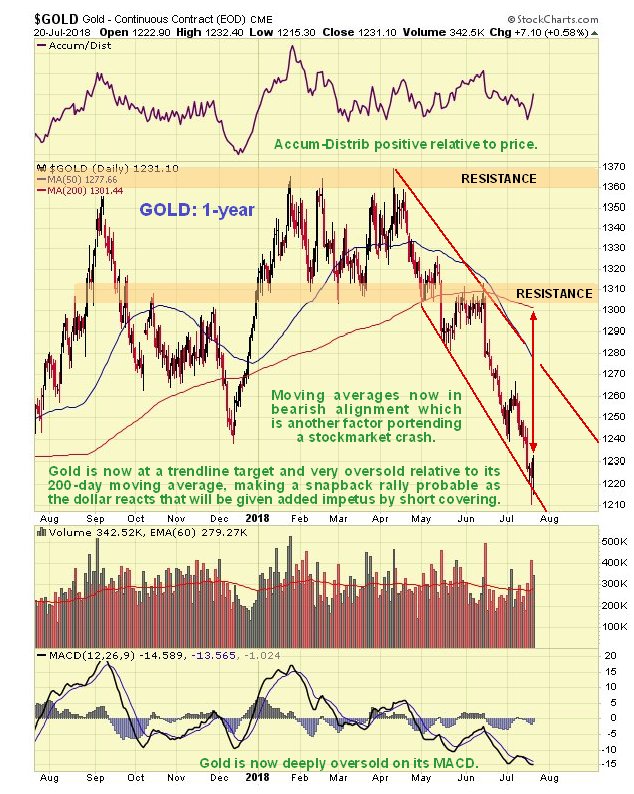
Starting with gold we see that it has accelerated into a deeply oversold state on its MACD indicator and relative to its moving averages, with the drop from its April peak clipping $150 off its price. Clearly gold didn’t take kindly to the dollar’s latest rally. Gold’s accumulation line has held up well, however, which increases the chances of a snapback rally imminently, which will be augmented by sudden short covering, as mentioned above.
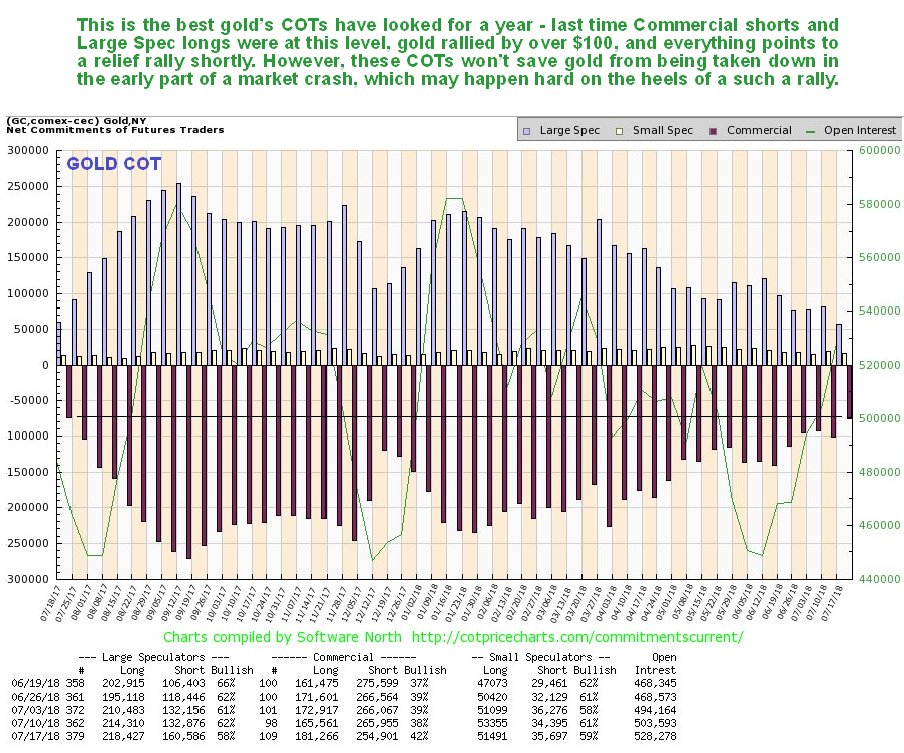
Not surprisingly, gold’s COTs have improved substantially as this drop has unfolded, and this past week arrived at a level that is construed as bullish, as the manic-depressive and wrong Large Specs gave up on gold in increasingly numbers. These are the best readings we have seen for a year, and while they don’t guarantee an immediate rally, they make one highly likely.
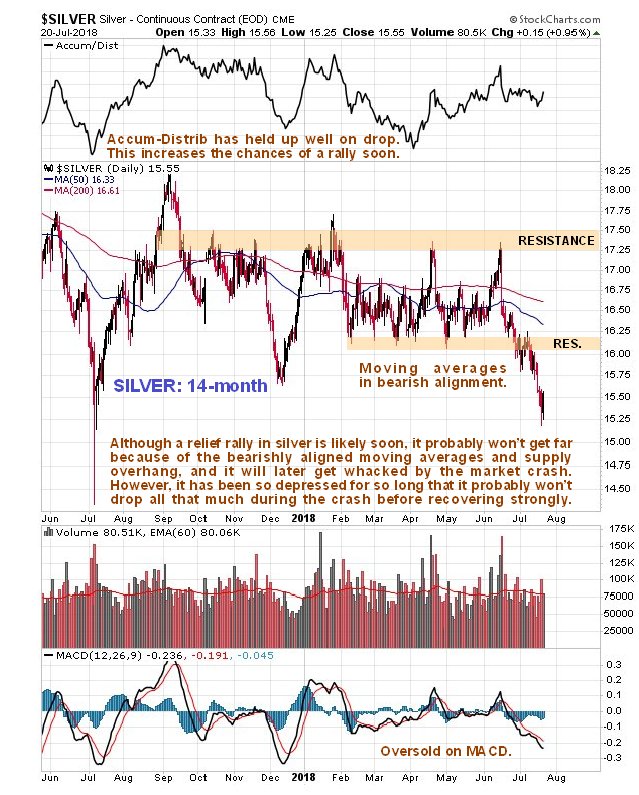
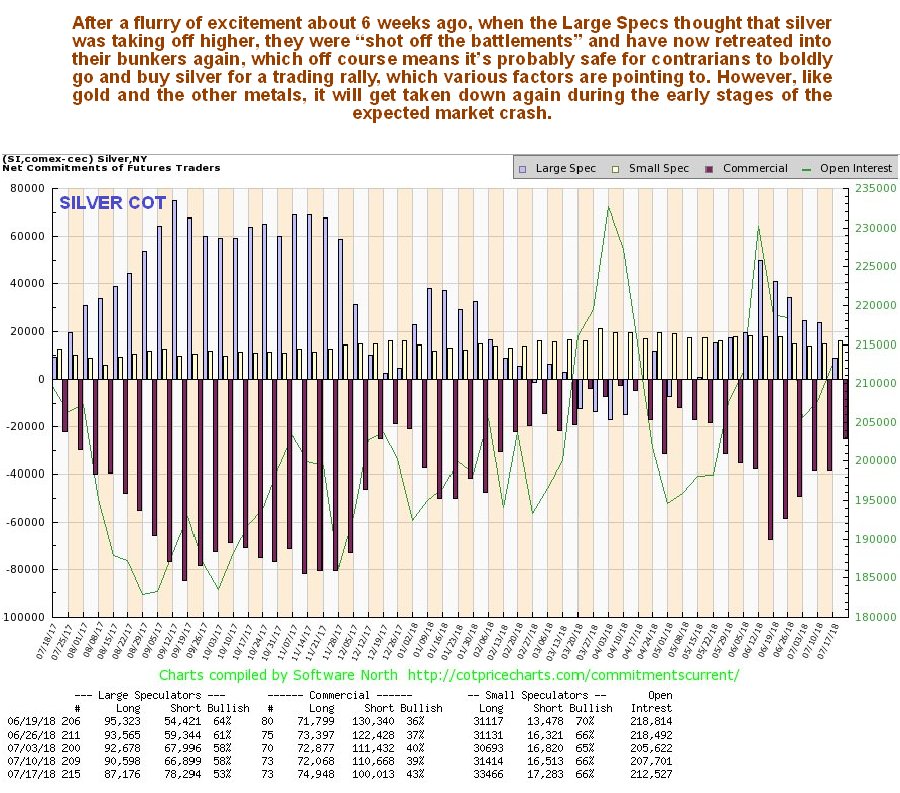
Silver has also dropped, albeit rather grudgingly, because it is already so depressed, and it is noteworthy that it is approaching—but has not dropped below—its lows of last July, as we can see on its 14-month chart (this timeframe selected to show this low). While not as oversold as gold, it too looks set to bounce back as well, although it will encounter significant resistance above $16. As with gold, silver’s accumulation line has held up well and supports a rally soon.
Silver’s latest COT chart shows that the Large Specs suddenly got enthused some weeks back, before they were shot off the parapets and finally crawled back into their holes last week in a capitulative manner after their long positions plunged to a low level. While commercial short positions could drop a bit more (Small Specs are still quite bullish), they have certainly dropped enough to permit a rally to develop.
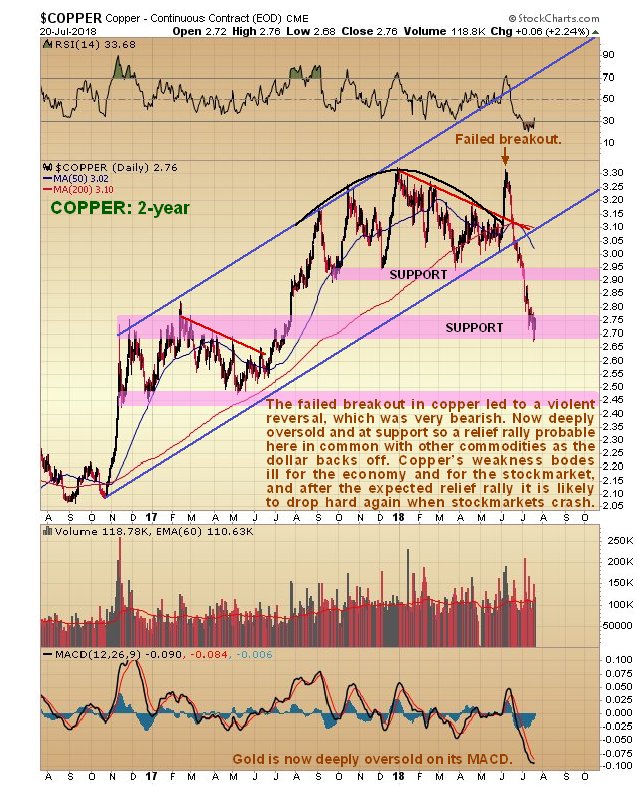
Moving on, we see that poor old Dr. Copper has “taken it on the chin” in recent weeks, after a failed attempt to break out into a third up-wave was followed by a violent reversal and breakdown from its long-term uptrend. This alone has bearish implications for the entire world economy. However, it is now deeply oversold, at support, and thus in position to stage a relief rally. We are looking at a 2-year chart for copper to see the origin of its long-term uptrend, and also to see the significant support that exists at and just below current levels, which arises from considerable trading in the trading range from November 2016 through July 2017.
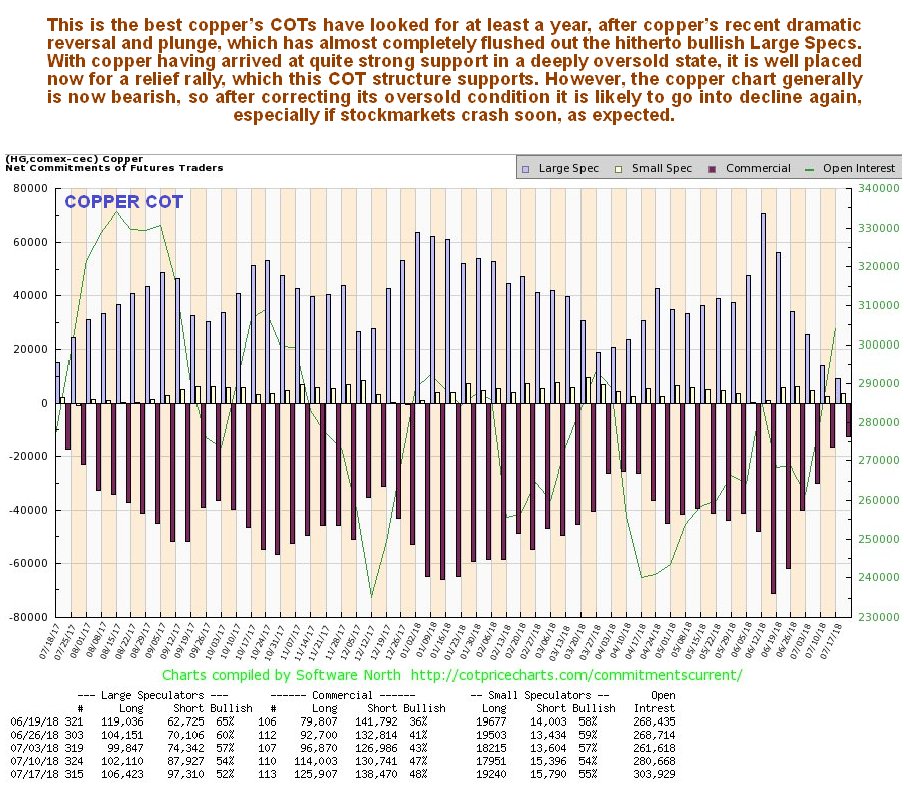
Copper’s COTs now look decidedly bullish for the near term, with the Large Specs, having taken a severe beating, giving up and heading for the hills—which, of course, greatly increases the chances that it will now rally.
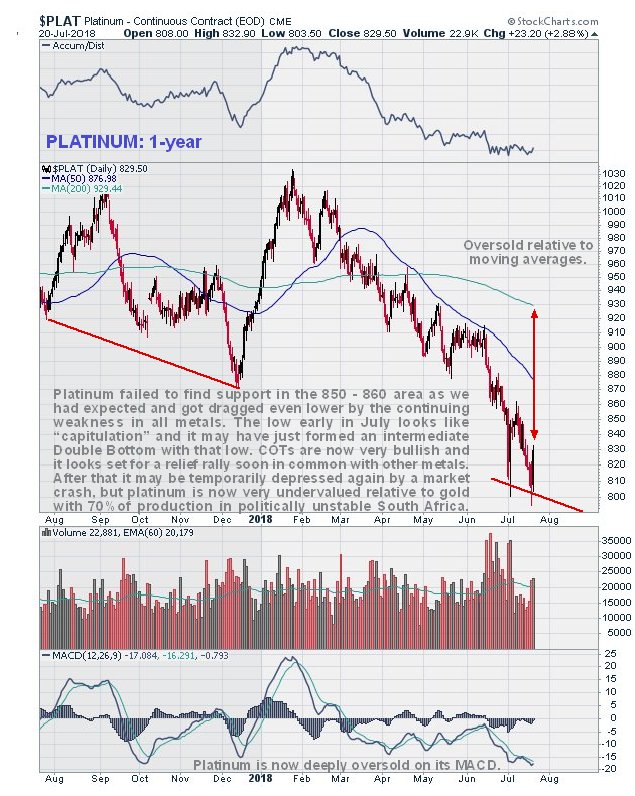
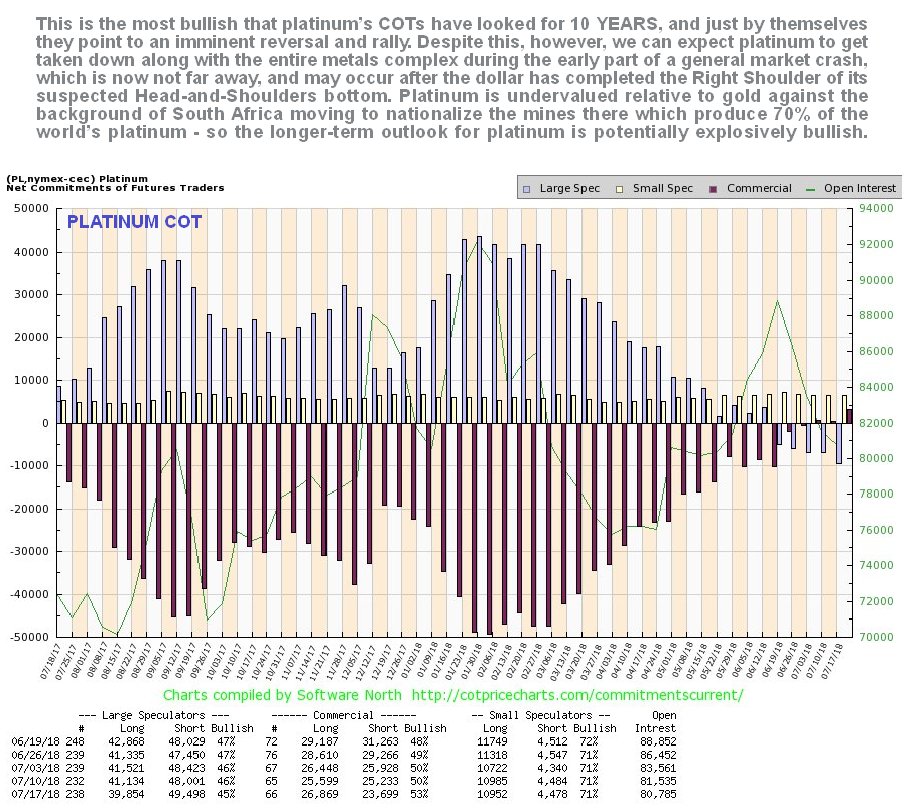
You may recall that we thought platinum had hit bottom some weeks back, largely on account of the collapse in Large Spec long positions. But it has since dropped even farther in sympathy with the sector. We now have a situation where the Large Specs are short to a significant degree, which is considered very foolish given how undervalued platinum is relative to gold. Of all the metals, platinum looks like the best value here. The spike down to a low early in July looks like a capitulative move, and the low of a few days back looks like a double bottom that will probably lead to a significant snapback rally—at least until the markets crash.
Clive Maund has been president of www.clivemaund.com, a successful resource sector website, since its inception in 2003. He has 30 years’ experience in technical analysis and has worked for banks, commodity brokers and stockbrokers in the City of London. He holds a Diploma in Technical Analysis from the UK Society of Technical Analysts.
[NLINSERT]
Disclosure:
1) Clive Maund: I, or members of my immediate household or family, own shares of the following companies mentioned in this article: None. …read more
From:: The Gold Report