

click to enlarge
As you might expect, energy was the greatest contributor to higher prices in May, with fuel oil jumping more than 25 percent from the same month a year ago. The current average price for a gallon of regular gas nationwide was just under $3.00, compared to only $2.33 in June 2017, according to the American Automobile Association (AAA).
Inflation is set to get an even bigger jolt now that President Donald Trump has formally approved 25 percent tariffs on as much as $50 billion of Chinese goods. China has already announced retaliatory action. While I agree some targeted tariffs are welcome to address intellectual property theft,
The U.S. inflation story made further inroads this month, with year-over-year price growth for consumers and producers alike hitting multiyear highs. U.S. consumer prices expanded at their strongest pace in more than six years, climbing to an annual change of 2.8 percent in May. Prices for final demand goods, meanwhile, grew 3.1 percent, their strongest annual surge since December 2011.
As you might expect, energy was the greatest contributor to higher prices in May, with fuel oil jumping more than 25 percent from the same month a year ago. The current average price for a gallon of regular gas nationwide was just under $3.00, compared to only $2.33 in June 2017, according to the American Automobile Association (AAA).
Inflation is set to get an even bigger jolt now that President Donald Trump has formally approved 25 percent tariffs on as much as $50 billion of Chinese goods. China has already announced retaliatory action. While I agree some targeted tariffs are welcome to address intellectual property theft, tariffs at the wholesale level are essentially regulations that threaten to undermine all the work Trump has done to supercharge the U.S. economy. They act as headwinds to further growth, which in turn makes gold look attractive as a safe haven investment.
Blaming OPEC
Let’s return to energy for a moment. Hot off the success of his historic summit with North Korea leader Kim Jong-un, Trump took a stab at foreign oil producers last week, tweeting: “Oil prices are too high, OPEC is at it again. Not good!”
The president isn’t wrong, but I believe he may be overselling the Organization of Petroleum Exporting Countries’ influence here. In May, the 14-member cartel added an extra 35,000 barrels per day (bpd) in output compared to the previous month, to reach a total of 31.8 million bpd. This is down from the average 32.6 million and 32.4 million bpd OPEC collectively produced in 2016 and 2017.
Venezuela’s output deteriorated once again, falling more than 42 percent in May to 1.4 million bpd, which is less than half of what it produced 20 years ago.
The beleaguered South American country didn’t have the biggest monthly decline among OPEC members, however—that title belonged to Nigeria, which saw its April-to-May production tumble 53.5 percent to 1.7 million bpd. Analysts predict output could fall further to 1.4 million bpd by July—a level not seen since 1988—as the country’s Nembe Creek Trunk Line (NCTL) has had to be closed recently to address product theft along its route.
OPEC will meet later this month and is widely expected to loosen production curbs as global demand strengthens. In the meantime, the U.S. continues to pump even more oil on a monthly basis, and by 2019 it could be producing more than 11 million bpd for the first time ever. This would make it the world’s top oil producer, above Russia.
Want to learn more? Watch this brief video featuring Samuel Pelaez, who outlines the six factors we use to select best-in-class oil and gas exploration and production companies!
Gold Glitters on Inflation Fears and U.S. Budget Imbalance
 |
The inflation news helped support the price of gold, which traded as high as $1,309 an ounce last Thursday, its best intraday showing in four weeks.
The price jump came a day after the Federal Reserve lifted interest rates another 0.25 percent, the second time it has done so this year. Although rising rates have historically made the precious metal look less competitive, since it doesn’t offer a yield, gold markets could be forecasting slower economic growth as a result of higher borrowing costs, not to mention costlier servicing of corporate and government debt.
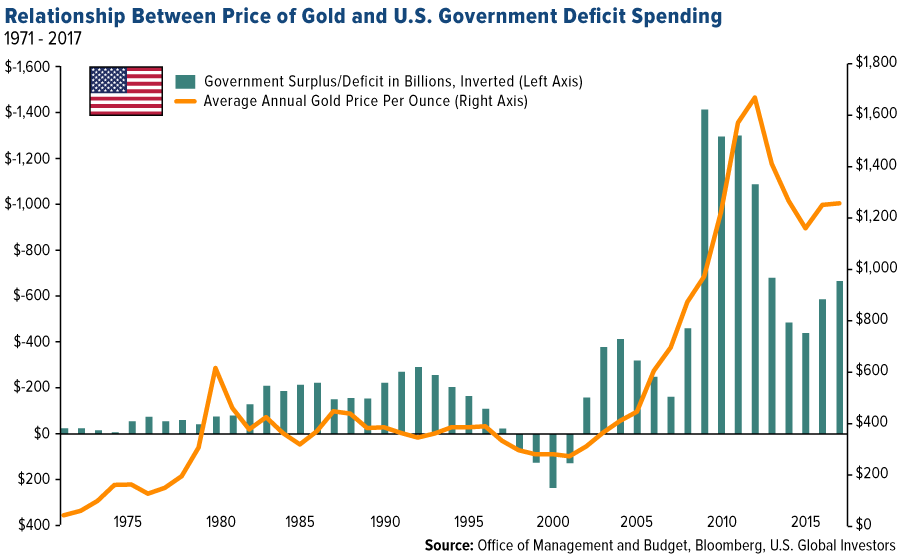
On that note, the Treasury Department announced last week that in the first eight months of the current fiscal year—October through May—the U.S. government deficit widened to a whopping $532 billion, or 23 percent more than the same eight-year period a year ago. That’s already more than the total deficits in fiscal years 2014 and 2015. Because of higher spending and lower revenues, it’s estimated that the deficit by the end of the fiscal year will balloon to $833 billion, which would be the greatest amount since 2012.
I believe this makes the investment case for gold and gold equities even more appealing as a store of value. In the chart below, notice how the price of gold has responded to government spending. I inverted the bars, representing surplus and deficit, to make the relationship more clear. In the years following the Clinton surplus of the late 90s, the difference between expenditure and revenue surged to new record amounts on the back of military spending in the Middle East and the multibillion-dollar bailouts of financial firms during the subprime mortgage crisis. Consequentially, the price of gold exploded.
Learn more about what’s driving the price of gold right now by clicking here!
How Close Are We to the End of the Business Cycle?
But back to the Fed. Besides lifting rates, the central bank has also signaled that we can expect two more hikes in 2018, suggesting it sees less and less need to accommodate a booming U.S. economy. Since the start of this particular rate hike cycle two and a half years ago, we haven’t yet seen four increases in a single calendar year.
This raises the question of how close we are to the end of the business cycle.
Rising rates, among other indicators, have often preceded the end of economic expansions and equity bull markets. Among other telltale signs: a flattening yield curve, record corporate and household debt, an overheated jobs market and increased mergers and acquisition (M&A) activity. So far this year, the value of global M&As has already reached $2 trillion, a new all-time …read more
From:: Frank Talk