
Source: Ron Struthers for Streetwise Reports 06/07/2018
Ron Struthers of Struthers Resource Stock Report discusses commodities and the markets, as well as a handful of companies that are on his radar screen.
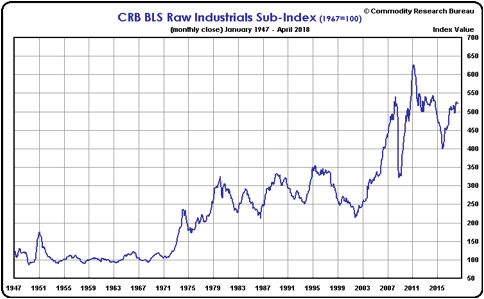
For sure there is a definite shift and turning point in the markets. There is little doubt now, commodities have started a new bull market. The BLS Raw Industrial Index is now up 31% from the 2015 low and will soon be testing long term resistance around 545. A break above 550 will mean a test of the 2011 high will be in order. The chart is to the end of April; on June 4th the index was at 522.37, so little changed.
Nickel prices are on the move from $6 per pound to $7 in the past 60 days and up from $4 a year ago. No sense pussy footing around, the U.S. tariffs on steel and aluminum have intensified a trade war that had already begun. The one thing for certain in trade wars is higher prices, and this alone ensures a break in the index above 550.
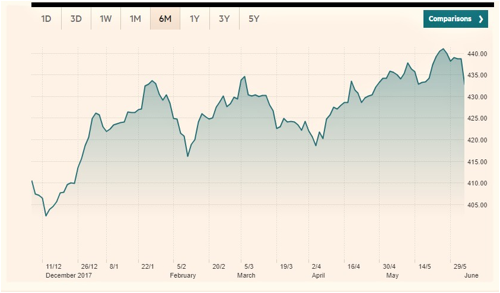
The CRB Index that I give less credibility is also starting to confirm with the recent move above 440, a 3 ½ year high and up 22% from the 2016 low. Since the index went to a black box algorithm in 2005, it increases weights in commodities falling in price and lowers weighting in those that are rising. It has proven to understate commodity inflation. The old CRB data is no longer available, hence my use of the Raw Industrials index for longer-term comparisons.
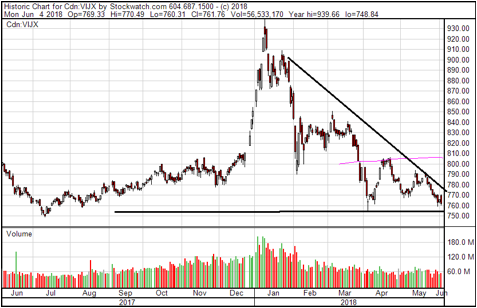
With the TSX Venture index, I pointed out the reversal of early April, but also expected a retest of this low that has now occurred. The down trend is obvious, but I am expecting this low to hold. In other words, I do not want to see a lower low.
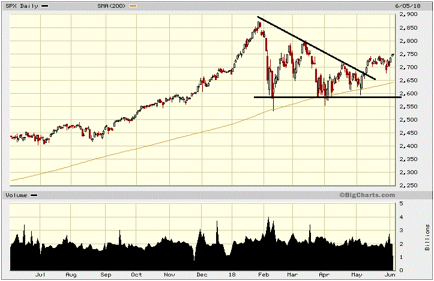
My update on the S&P 500 in early April involved a concern if the market would hold at support around 2580. If it did not, down side was to 2450 and if support held we would need to see a higher high over 2800 for the bull market to have a chance to continue. As you can see below, support held and the down trend has been broken. We are now headed to 2800 and if we go higher, I will be watching for a double top or a break to new highs. There has been good support built around 260 and with plenty of uncertainty abound, I expect we are going to be in a sideways market between 2600 and 2900 for the next several months.
This chart from Bloomberg is quite alarming. What has this smart money alarmed? Certainly some of the items I have mentioned above and further on in this report.
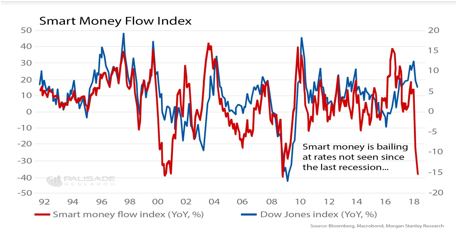
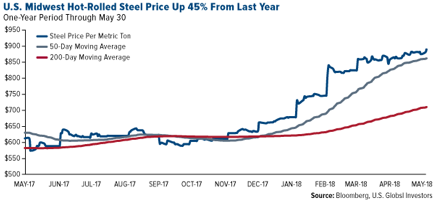
There are cracks appearing in the economic foundation. Delinquency rates on subprime auto loans are now higher than the financial crisis. The 25-year mortgage rate is at 7-year highs and will soon influence the real estate market. U.S. retail sales have been weak this year, averaging only 0.225% growth in the past four months. The good Trump did for the economy by cutting taxes could be undone by tariffs. Steel prices were already up 45% before the tariffs.
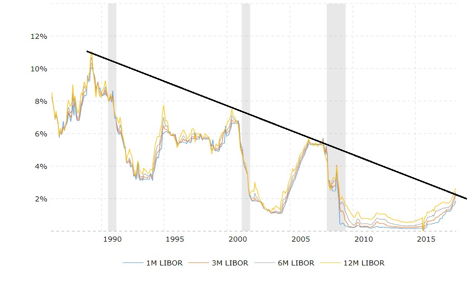
I will be keeping a close eye on economic indicators in the coming months. Again I want to highlight this chart on LIBOR rates I used in early April. Each economic cycle, more debt is piled on and each cycle, rates do not have to rise as much to start the next recession. Drawing a trend line it is easy to see that we are probably already approaching the peak in this cycle with a looming recession.
Sooner or later the gold price will react to higher inflationary pressures, but near term, the price is focused on next week’s FOMC meeting and rate hike. I believe the Fed will be limited to just one or two more hikes and next week’s increase will probably come with a dovish stance. The gold price often rallies after the Fed hike announcement and is set up for another recurrence. Thus far the rally in the US$ index has been retained by resistance in the 95 area. Weakness on the economic front would probably push the index back down.
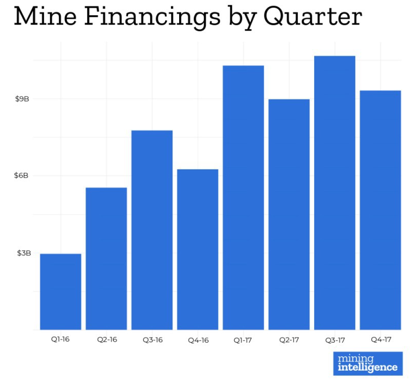
Regardless of the poor outlook we see on the indexes of the miners, the big and so called smarter money that is pouring out of general equities, a chunk is finding a path into the mining sector. Global mining exploration is expected to increase 15% to 20% year-over-year. In Canada the exploration spend has grown 37% in the last two years, and total exploration spend in 2018 is forecast at $2.2 billion.
There will be lots of developments with our resource based picks and I expect a substantial rally in the second half of the year. Huge news with Silver Bull Resources on Monday is an example of money coming into exploration. Silver Bull announced a US$100 million JV with mining giant South32, which must spend that amount to earn 70% in the Sierra Mojado project, Mexico.
Silver Bull Resources Inc. (SVB:TSX; SVBL:NYSE.MKT), Recent Price $0.19
Entry price $0.12, Opinion: Strong Buy
South32 is a globally diversified mining company with high-quality operations that mine and produce silver, zinc, lead, nickel, bauxite, alumina, aluminum, energy and metallurgical coal, and manganese. It currently operates in Australia, Southern Africa and South America and are valued with a market capitalization of approximately US$13 billion.
To earn its 70% option, South32 must contribute minimum exploration funding of US$10 million in the first four years with at least $3 million in year one. South32 may exercise its option at any time to buy 70% of Minera Metalin (Silver Bull’s Mexican subsidiary) by contributing US$100 million, less an amount of the initial funding …read more
From:: The Gold Report