Source: Clive Maund for Streetwise Reports 06/06/2018
Technical Analyst Clive Maund reviews a Texas energy junior’s charts and provides an update.
Amazing Energy Oil & Gas Co. (AMAZ:OTCQX) finally succumbed to continued pressure from the falling oil price yesterday and dropped sharply, losing 19% at the close, but fell considerably more during the day. However, the surprising thing about this move is that it did no technical damage to the stock whatsoever—on the contrary, this looks like the final drop that marks the end of the correction in force from early last December. On its latest 7-month chart we can see what happened in detail, and how, even though it dropped 19% at the close, it had still recovered a lot of the ground it lost during the day, so that it ended the day with a bull hammer on its chart. This candle formed on high volume and the interesting thing is that most of this volume was buying that drove it back up again. We know this from the Accumulation line, shown at the top of the chart, which actually rose to new highs yesterday. Furthermore, the action yesterday was not a “one day wonder”—it was the last in a series of long-tailed candles going back to early April, where buying kicked in from low levels and dove the price back up. This is why the Accumulation line has been so strong. This price/volume action portends a breakout into a new uptrend, and it happen soon, given that yesterday’s action is a clear sign of a final low.
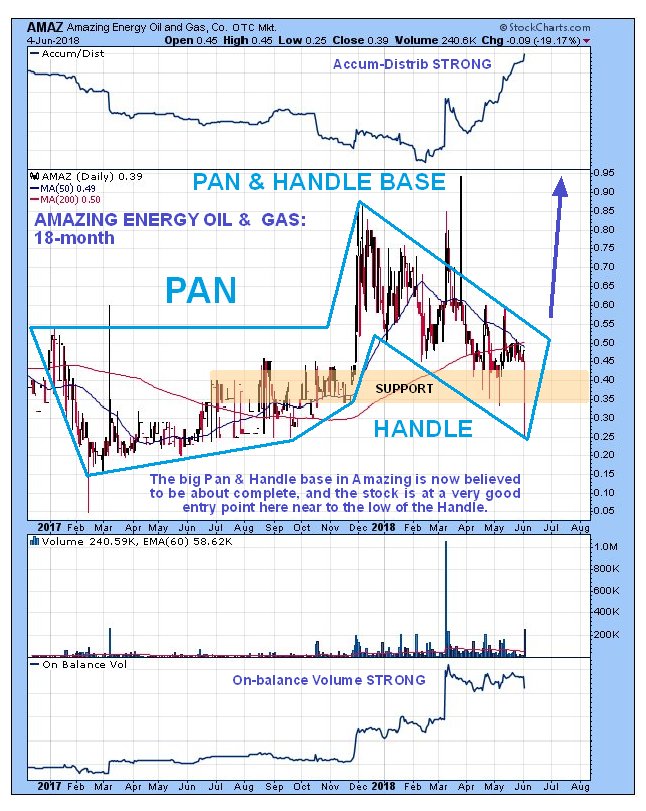
The 18-month chart is very useful as it enables us to grasp the big picture of what is going on with this stock. It reveals that the correction in force from last December is actually the Handle of a large Pan & Handle base pattern. With June 4th’s action indicating that the Handle of the pattern is at last complete, it should now proceed to turn up and break out upside in due course from the entire pattern into a bull market. While Amazing won’t necessarily require a rising oil price to achieve this, its charts do suggest that the oil price will at least hold up and possibly continue to advance further, and right now oil is oversold after its recent drop and set to at least stage a bounce, which should help Amazing.

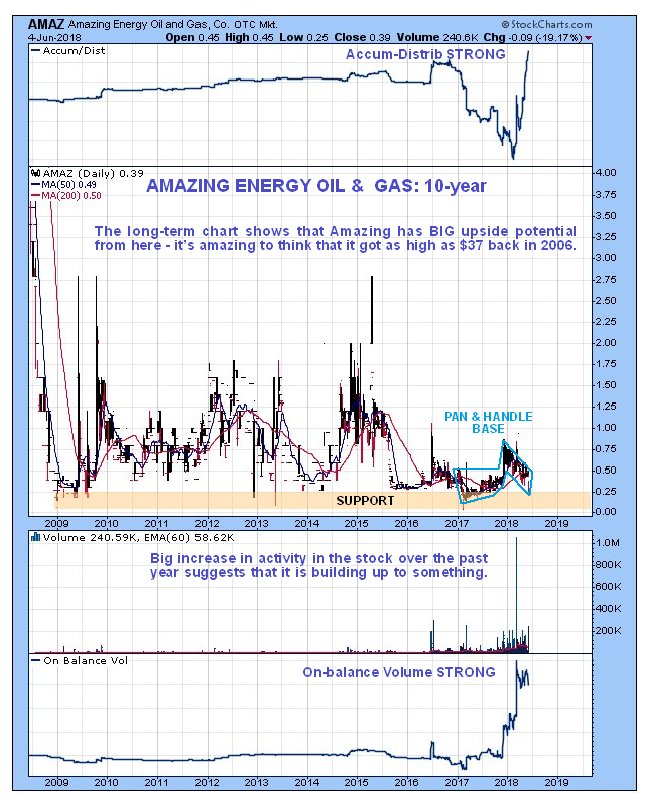
The long-term 10-year chart reminds us how cheap Amazing is historically, for as we can see it is still close to the bottom of a much larger base pattern that goes right back to 2009, and not shown on this chart is that it got as high as $37 back in 2006. The company has a reasonable 77.7 million shares in issue.

Amazing Energy Oil & Gas website.
Amazing Energy Oil & Gas Co, AMAZ on OTC, closed at $0.39 on 4th June 18.
Clive Maund has been president of www.clivemaund.com, a successful resource sector website, since its inception in 2003. He has 30 years’ experience in technical analysis and has worked for banks, commodity brokers and stockbrokers in the City of London. He holds a Diploma in Technical Analysis from the UK Society of Technical Analysts.
Read what other experts are saying about:
Want to read more Energy Report articles like this? Sign up for our free e-newsletter, and you’ll learn when new articles have been published. To see a list of recent articles and interviews with industry analysts and commentators, visit our Streetwise Interviews page.
Disclosure:
1) Clive Maund: I, or members of my immediate household or family, own shares of the following companies mentioned in this article: None. I personally am, or members of my immediate household or family are, paid by the following companies mentioned in this article: None. My company has a financial relationship with the following companies mentioned in this article: None. CliveMaund.com disclosures below. I determined which companies would be included in this article based on my research and understanding of the sector.
2) The following companies mentioned in this article are billboard sponsors of Streetwise Reports: Amazing Energy. Click here for important disclosures about sponsor fees. As of the date of this article, an affiliate of Streetwise Reports has a consulting relationship with Amazing Energy. Please click here for more information.
3) Statements and opinions expressed are the opinions of the author and not of Streetwise Reports or its officers. The author is wholly responsible for the validity of the statements. The author was not paid by Streetwise Reports for this article. Streetwise Reports was not paid by the author to publish or syndicate this article. The information provided above is for informational purposes only and is not a recommendation to buy or sell any security. Streetwise Reports requires contributing authors to disclose any shareholdings in, or economic relationships with, companies that they write about. Streetwise Reports relies upon the authors to accurately provide this information and Streetwise Reports has no means of verifying its accuracy.
4) This article does not constitute investment advice. Each reader is encouraged to consult with his or her individual financial professional and any action a reader takes as a result of information presented here is his or her own responsibility. By opening this page, each reader accepts and agrees to Streetwise Reports’ terms of use and full legal disclaimer. This article is not a solicitation for investment. Streetwise Reports does not render general or specific investment advice and the information on Streetwise Reports should not be considered a recommendation to buy or sell any security. Streetwise Reports does not endorse or recommend the business, products, services or securities of any company mentioned on Streetwise Reports.
5) From time to time, Streetwise Reports LLC and its directors, officers, …read more
From:: The Energy Report
