
By Brian Maher
This post What History Teaches About Interest Rates, Part II appeared first on Daily Reckoning.
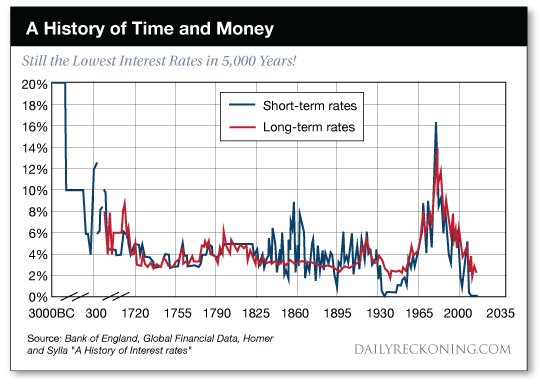
Yesterday we presented evidence that interest rates have trended lower for the better part of 500 years.
We also suggested that the high interest rates of the mid-to-late 20th century may be history’s true aberration.
Let us here reintroduce the prosecution’s evidence:
Here, in graphic form, five centuries of generally descending real long-term rates — before a Himalayan spike in the mid-to-late 20th century.
Real interest rates, we should mention, are nominal rates minus inflation.
If nominal rates are 3%, for example, while inflation runs at 1%, the real rate is 2% (3 – 1 = 2).
As Harvard economics professor Paul Schmelzing noted in yesterday’s reckoning, “Real rates have been following a downward path for close to 500 years on a variety of measures.”
But we’ve dug even deeper into the historical data… rooted around for omens… and emerged with disturbing findings.
Details to follow…
Over seven centuries, Schmelzing identifies nine “real rate depression cycles.”
These cycles feature a secular decline of real interest rates… followed by reversals.
The first eight cycles tell fantastic tales…
These cycles often pivoted around such events as the Black Death of the mid-14th century… the Thirty Years’ War of the 17th century… World War II.
The world is currently immersed in history’s ninth rate depression cycle, which began in the mid-’80s.
Schmelzing says the closest historical analogy to the present cycle is the worldwide “Long Depression” of the 1880s and ’90s.
This “Long Depression” saw “low productivity growth, deflationary price dynamics and the rise of global populism and protectionism.”
Need we list the parallels to today?
It is here where our tale gathers pace…
Schmelzing’s research reveals that the present cycle is the second longest of the entire 700-year record… and the second most intense.
The only cycle to have lasted longer came in the 15th century.
Only one previous cycle — also from the same epoch — exceeded the current cycle in intensity.
By almost any measure… today’s rate depression cycle is a thing of historic grandeur.
The steep downward slope on the extreme right of the chart gives the flavor of its severity:
Schmelzing’s researches show that the real rate for the entire 700-year history is 4.78%.
Meantime, the real rate for the past 200 years averages 2.6%.
And so “relative to both historical benchmarks,” says this Schmelzing fellow, “the current market environment thus remains severely depressed.”
That is, real rates are well below historical norms.
And if the term “reversion to the mean” has any currency… things could get rather interesting… rather quickly.
Because history shows that when rates do regain their bounce, they do so with malice.
If the world is near the end of the current 34-year rate depression cycle, it could be in for a nasty lesson in mean reversion.
Schmelzing:
The evidence from eight previous “real rate depressions” is that turnarounds from such environments, when they occur, have typically been both quick and sizeable… Most reversals to “real rate stagnation” periods have been rapid, nonlinear and took place on average after 26 years.
How rapid? How …read more
Source:: Daily Reckoning feed
The post What History Teaches About Interest Rates, Part II appeared first on Junior Mining Analyst.