
By Jody Chudley
This post Is Your State Financially Screwed? appeared first on Daily Reckoning.
George Mason University’s Mercatus Center just released their annual “Ranking of States by Financial Condition” report.
The report provides all Americans a chance to see how their respective state ranks in terms of financial condition.1
But as I’m about to show you, the report reveals more than that. More specifically, it reveals something you might want to consider next time you step into the voting booth…
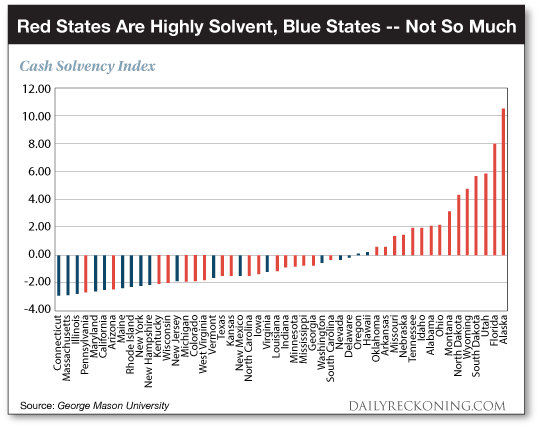
When analyzing the results of the George Mason study, the difference in financial condition of blue and red states is not subtle. The chart that I’m about to show you captures the cash solvency of each state makes the difference shockingly clear.
Cash solvency is the ability to meet bills that are due in the next 30 to 60 days.
In other words, which states can each state meet its short term debt obligations?
States with negative cash solvency figures have some near term financing issues to address. And the larger the negative number, the more pressing the issue.
Take a look at the chart below…
Click to enlarge
The majority of states do not exactly have their short term financial house in order…
But do you notice anything else about George Mason’s cash solvency analysis?
(Remember, negative numbers are bad and positive numbers are good.)
Of course you do! All of the states with good cash solvency rankings are red states, meanwhile 9 of the 11 states with the weakest cash solvency position are blue states.
And you might think I’m cherry picking data to make the financial condition of red states look better than blue states…
But I’m not!
But rather than just trust me, let’s also look at how George Mason’s long-term cash solvency analysis looks. This index looks more at the entire condition of each state (the full balance sheet), rather than just short term assets and cash on hand.
This measure includes assets like government owned land and buildings, and long-term liabilities like pension funding and debt issued for funding projects.
Keep in mind, whereas a short term solvency issue can be solved pretty quickly, a balance sheet with a long-term issue of liabilities far outweighing debt is tough to escape…
Again, a negative result is bad and a positive result is good:
Click to enlarge
What we see in the chart is that while the order of states move around a little bit, the conclusion that we have to draw is pretty much exactly the same.
The financially sound states are all red and the states with problems are virtually all blue.
Fourteen of the fifteen most solvent states for the long-term are red states. While thirteen of the fifteen least solvent states for the long-term are blue states…
Unbelievably – This Is Not A 2016 Election Map!
I feel at this point I must make sure that you are aware that I am Canadian. I have no dog in this fight, I’m just an interested observer.
I’m taking information and seeing …read more
Source:: Daily Reckoning feed
The post Is Your State Financially Screwed? appeared first on Junior Mining Analyst.