By analyst
By Frik Els
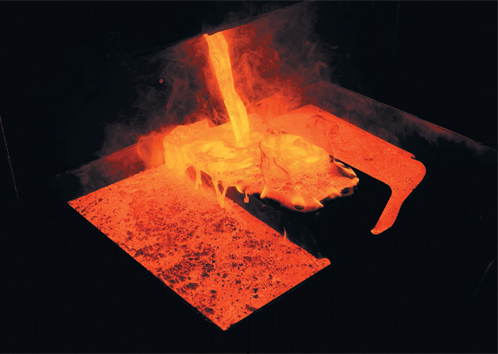
Fluid ounces. Image: Polyus Gold
To give a true picture of the size and potential of the globe’s largest deposits of gold, MINING.com and sister company IntelligenceMine ranked the orebodies according to total resources – measured, indicated and inferred. Many companies include proven and probable reserves that can be economically extracted in resource estimates and the ranking was adjusted where this wasn’t the case.
Overall resources can also change significantly over time, often when resources are moved into the proven and probable category. For instance, the Livengood project in Alaska being advanced by Tower Hill Mines fell to just outside the top 20 after the company updated resources in August last year, cutting nearly 10moz from the total estimate. Things also move in the opposite direction with Seabridge continuing to add ounces to its KSM project in British Columbia.
Looking at proven and probable reserves only is a moving target as gold prices and mine economics change. When considering proven & probable reserves only Freeport’s Grasberg in Indonesia moves to the top followed by KSM and Barrick and Novagold’s Donlin joint venture in Alaska.
Closely watched projects in the top 20 include Newcrest and Harmony Gold’s Wafi-Golpu project in Papua New Guinea which ranks no. 11 with 37.6moz of reserves, AngloGold’s mothballed Obuasi mine in Ghana (no. 17 with 27.3moz), and Barrick’s stalled Pascua Lama property straddling the border between Chile and Argentina (no. 19 – 22.8moz).
The size of a deposit is not always a good indication of the size or output of a mine. Three in the top 10 ranking are projects in various stages of development with economic assessments that project widely differing annual production numbers. Gold grades do not necessarily push mine plans in a certain direction either – in this ranking grades range from a miserly 0.34g/t to a mouth watering 17.4g/t.
At existing mines there is also little correlation. For example, disclosed resources at Barrick Gold’s Goldstrike in Nevada which is one of only a handful of mines where annual output regularly tops 1moz, is half that of the world’s 20th largest deposit (NGEx’s Constellation project on the Chile-Argentina border).
The top producing gold mine in the world is Uzbekistan’s Muruntau which dependably pours more than 2 million ounces per year. The state-owned mine is not included in this list because operators Navoi Mining & Metallurgy Combinat does not disclose any figures, but resource guesstimates range anything from 50moz to 150moz despite being mined since 1967.
The post INTERACTIVE MAP: World’s top 10 gold deposits appeared first on MINING.com.
Source:: Infomine
The post INTERACTIVE MAP: World’s top 10 gold deposits appeared first on Junior Mining Analyst.

