
To show you just how far we’ve come, I put together a few comparisons of several indices and economic factors between March 2009 and now.
| March 2009 | Most Recent Data, March 2017 | Percent Change | |
|---|---|---|---|
| S&P 500 Index | 666.79 (intraday low, March 6) | 2,400.98 (intraday high, March 1) | 260% |
| Dow Jones Industrial Average | 6,440.08 (intraday low, March 9) | 21,169.11 (intraday high, March 1) | 228% |
| University of Michigan Consumer Sentiment Index | 69.5 | 96.3 | 38% |
| U.S. ISM Manufacturing Purchasing Managers’ Index (PMI) | 35.8 | 57.7 (February) | 61% |
| Housing Starts | 505,000 | 1,290,000 | 155% |
| Light Vehicle Sales | 9,552,000 | 17,465,000 | 83% |
| Unemployment | 8.7% | 4.7% (February) | -45% |
| Gold | $885 (intraday low, March 18) | $1,248.30 (intraday high, March 1) | 41% |
| Sources: S&P Dow Jones Indices, Bureau of Economic Analysis, University of Michigan, Bureau of Labor Statistics, Census Bureau, ISM, IBA | |||
Of course, there have been market skeptics. As others have pointed out, this particular bull run—the second-longest in U.S. history—has arguably been the least loved, with many investors calling it artificial and arguing that it’s been driven not by fundamentals but the Federal Reserve’s policy of record-low interest rates.
Now there are those who wonder how much longer this bull run can last. And if it ends, will it be with a bang or a whimper?
“Trump Rally” Could Have Further Room to Grow
It’s important to keep in mind the old investing adage, “Bull markets don’t die of old age.” Bear markets have been incited by everything from geopolitical conflicts to stagflation to oil price shocks to financial crises. Although no one can say with all certainty that age is irrelevant in a market’s longevity, there are signs that the current eight-year-old run has further room to grow, at least in the short term.
President Donald Trump’s pro-growth policy proposals, including lower corporate taxes, deregulation and infrastructure spending, have jolted many people’s “animal spirits,” with several indices already hitting near-record highs. In January, the Index of Small Business Optimism
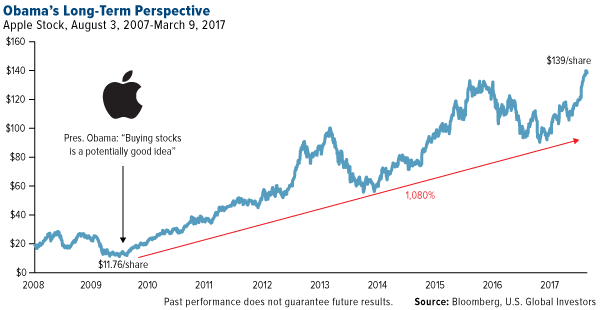
Eight years ago last week, President Barack Obama gave investors a surprisingly hot trading tip. In office less than two months, he commented that we were at “the point where buying stocks is a potentially good deal if you’ve got a long-term perspective.”
Obama couldn’t have known then how accurate his call was. The market found a bottom that very week, and investors who took the president’s advice managed to get in on the absolute ground floor.
At the time, investor sentiment was at or near record lows. The number of S&P 500 Index stocks trading below $10 a share had grown tenfold since the end of 2007. The New York Stock Exchange, in fact, had to temporarily suspend its requirement that equities trade at more than $1 a share. Giant companies such as Citigroup and General Motors—a share of which cost little more than a pocketful of spare change—were at risk of being delisted.
Today, many of those bullish investors have seen some spectacular gains. Since its low of 666 in March 2009, the S&P 500 has climbed a whopping 260 percent, with not a single year of losses. The average annual return has been over 15.7 percent, based on Bloomberg data. With dividends reinvested, it’s closer to 18 percent.
Just take a look at Apple, which has surged more than 1,080 percent as it introduced or expanded its line of got-to-have, now-ubiquitous products, from the iPhone to iPad.
click to enlarge
To show you just how far we’ve come, I put together a few comparisons of several indices and economic factors between March 2009 and now.
You’ve Come a Long Way, Baby: U.S. Economy Then and Now
March 2009
Most Recent Data, March 2017
Percent Change
S&P 500 Index
666.79 (intraday low, March 6)
2,400.98 (intraday high, March 1)
260%
Dow Jones Industrial Average
6,440.08 (intraday low, March 9)
21,169.11 (intraday high, March 1)
228%
University of Michigan Consumer Sentiment Index
69.5
96.3
38%
U.S. ISM Manufacturing Purchasing Managers’ Index (PMI)
35.8
57.7 (February)
61%
Housing Starts
505,000
1,290,000
155%
Light Vehicle Sales
9,552,000
17,465,000
83%
Unemployment
8.7%
4.7% (February)
-45%
Gold
$885 (intraday low, March 18)
$1,248.30 (intraday high, March 1)
41%
Sources: S&P Dow Jones Indices, Bureau of Economic Analysis, University of Michigan, Bureau of Labor Statistics, Census Bureau, ISM, IBA
Of course, there have been market skeptics. As others have pointed out, this particular bull run—the second-longest in U.S. history—has arguably been the least loved, with many investors calling it artificial and arguing that it’s been driven not by fundamentals but the Federal Reserve’s policy of record-low interest rates.
click to enlarge
Now there are those who wonder how much longer this bull run can last. And if it ends, will it be with a bang or a whimper?
“Trump Rally” Could Have Further Room to Grow
It’s important to keep in mind the old investing adage, “Bull markets don’t die of old age.” Bear markets have been incited by everything from geopolitical conflicts to stagflation to oil price shocks to financial crises. Although no one can say with all certainty that age is irrelevant in a market’s longevity, there are signs that the current eight-year-old run has further room to grow, at least …read more
Source:: Frank Talk
The post The Bull Market Just Turned Eight. What Now? appeared first on Junior Mining Analyst.