April 1, 2016

No one can predict the future, but charts can provide a useful roadmap to help guide us through uncertainty. Charts do this because they illustrate price trends – whether up, down or sideways – and it is always important to keep your investment portfolio in harmony with the trend.The following weekly chart of Bitcoin’s exchange rate to the US dollar is a good example that shows how charts illustrate a trend.
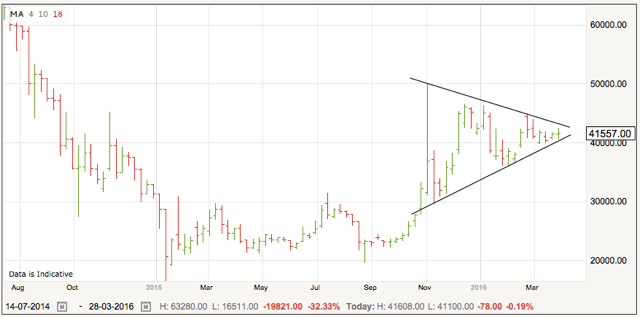
Since November, Bitcoin’s exchange rate has essentially been moving sideways. More precisely, it has fluctuated within an increasingly narrow range to form a large pennant.
Pennants form to reflect a period of consolidation. In the chart above, we can see how Bitcoin shot up last autumn, more than doubling from the $220s and briefly touching $500. It then dropped back and since then has been fluctuating within this large pennant.
It doesn’t always work this way, but typically when a large pennant forms, it is a signal that a big price move will occur when the pennant is broken, either up or down.
So which will it be for Bitcoin? An upside breakout that will take it back to and perhaps above $500? Or a downside breakout that could take it back to last year’s lows around $200?
Well, there’s the rub. No one can predict the future, but we should be prepared. Whatever happens, it looks like a big move one way or the other is about to happen.