If History Repeats, Gold Is Headed to $8,000
Contributed Opinion
Source: Jason Hamlin for Streetwise Reports (11/18/19)
 Sector expert Jason Hamlin explores the potential of the current gold bull market by charting the courses of past bull markets.

The gold price bottomed in late 2015 around $1,050 per ounce. It has since advanced to a high of $1,555 in early September, followed by a pullback to the current price of $1,470. Gold is in a well-defined uptrend channel with higher lows and recently higher highs. The breakout above $1,360 this summer was significant and we have seen follow-through buying. The $420 move in the price of gold from the bottom in late 2015 represents a gain of 40% in just under four years.
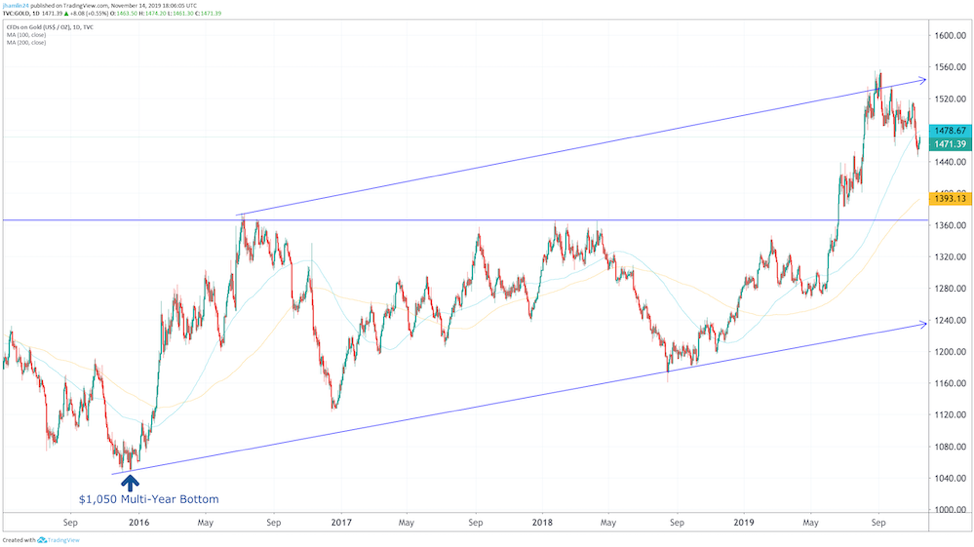
While this is a respectable gain, it only scratches the surface of the potential move ahead. To understand why, let’s take a look at the last two major bull markets in gold.
From 1971 to 1980, the gold price rocketed from a low of $35 to briefly peak at a high of around $850 ($678 high on the weekly chart) for a gain of just over 2,000%. It was closer to 850% in inflation-adjusted terms.
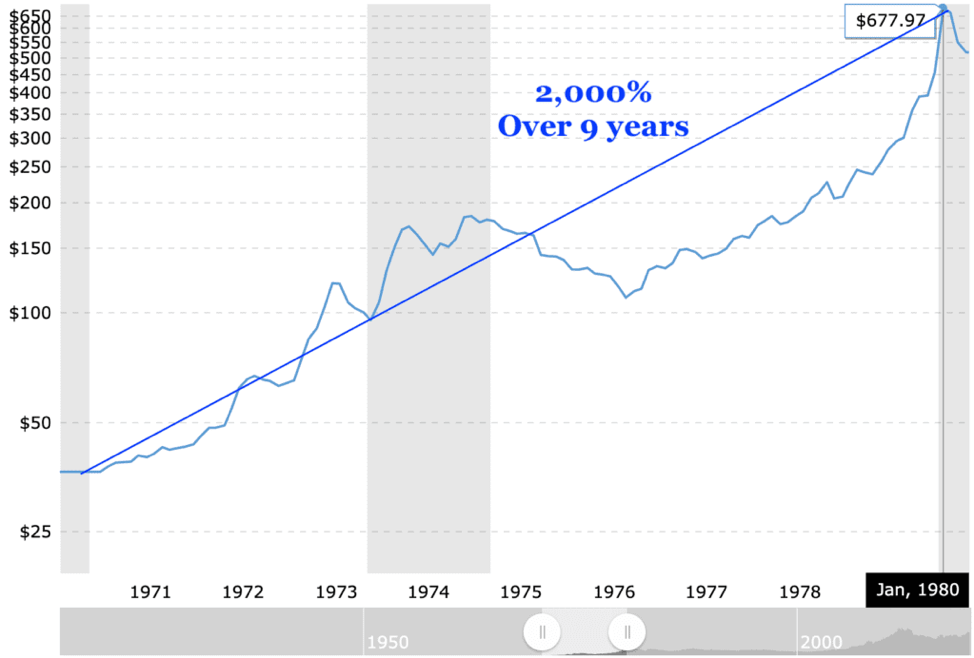
Gold Price, Source
Of course, this massive move was driven by the abandonment of the gold standard window by Nixon, a stampede into gold as a safe haven from double-digit inflation, oil price shocks, a weak dollar, and political instability that made investors fearful and nervous.
Fast-forward to 2001 and we can see that gold made another impressive move from $250 to a weekly high of $1,825 ($1,920 daily) over the course of roughly the same time period. This represents a gain of around 600% in that decade, or 450% in inflation-adjusted terms.
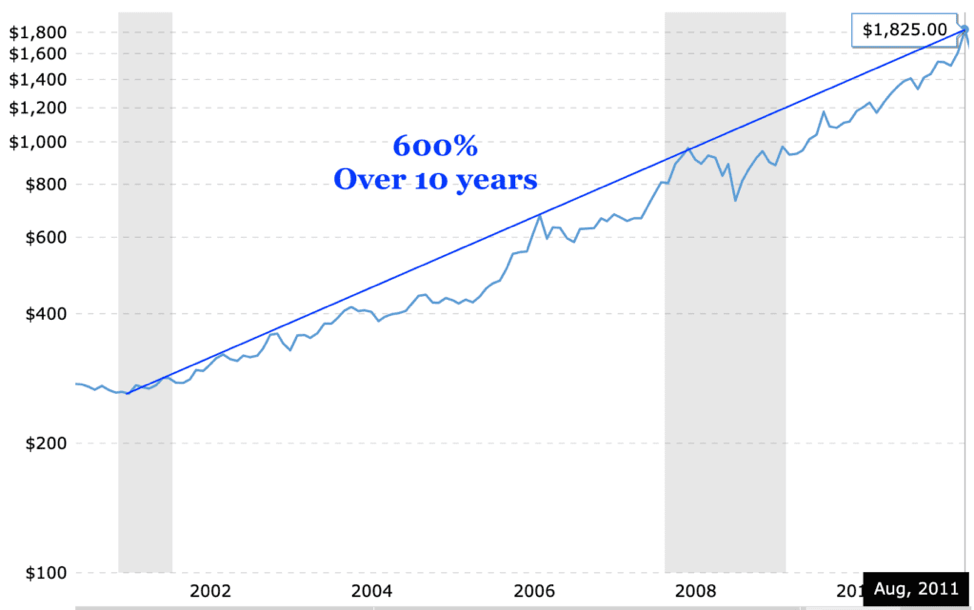
Gold Price, Source
The current bull market cycle in gold is nearly four years old but hasn’t broken out of the gates yet. The 40% move higher since the start of 2016 is a modest advance relative to the last two bull markets. The gold price is moving higher today, so the chart below shows a 38% gain since the bottom.
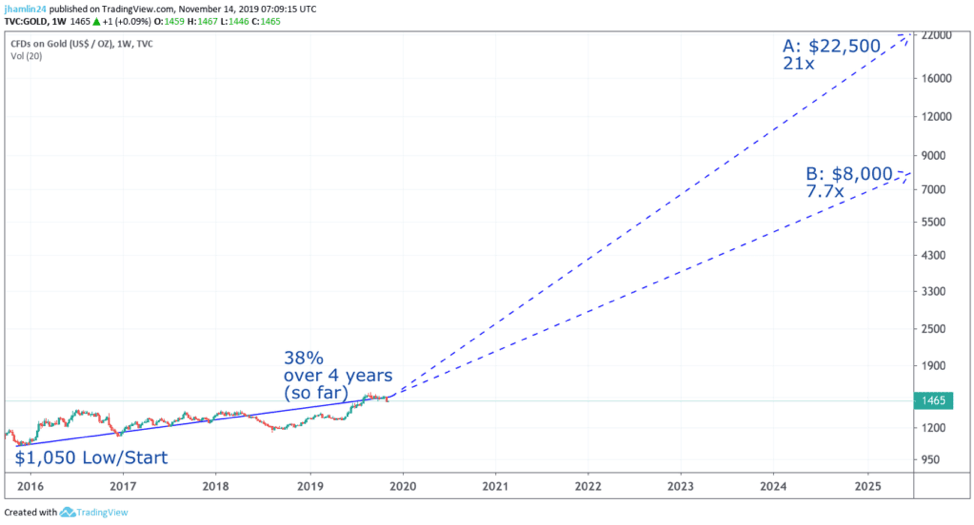
The price would still need to go up roughly 15x (1,400%) to match the 1970s bull market, which would take the price to over $22,000! Or it would need to go up another 5.5x (450%) to $8,000 to match the magnitude of gains from the 2001–2011 bull market.
Put simply, the gold price has an explosive move ahead if the current bull cycle is to come anywhere close to the magnitude of the past two bull cycles.
While we don’t have runaway inflation (yet) and we aren’t facing a closing of the gold convertibility window as Nixon did in 1971, we do have quite a few factors that should be supportive of the gold price going forward.
These include record debt and deficits, a record-high debt-to-GDP ratio, interest rates dropping toward zero, the Federal Reserve expanding its balance sheet at twice the pace it was during QE3 (just don’t call it quantitative easing!), the Fed intervening in various markets to provide emergency liquidity, a crisis in confidence in governments and political unrest worldwide, the potential for the impeachment of the United States president, elevated geopolitical tensions between world powers, a global de-dollarization movement that is accelerating, slowing economic growth, historically overvalued equity markets, a record low commodity-to-equities ratio and record-high total stock market cap to GDP ratio.
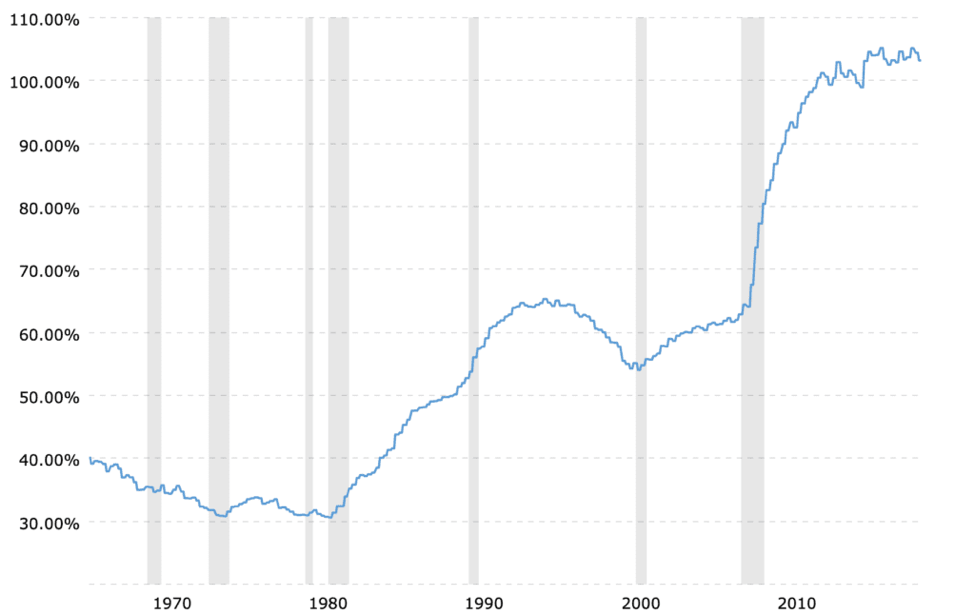
U.S. Debt-to-GDP, Source
If anything, the underlying conditions that caused the gold price to spike 20x in the 1970s could be viewed as even worse today. We have a massive derivatives issue and corporate debt problem that many view as ticking time bombs. This grand experiment with fractional reserve fiat paper money being used as a world reserve currency is likely coming to an end.
As it does, people will move toward forms of money with a limited supply that are not controlled by centralized authorities. Whether this is gold-backed money, digital currency from a tech giant or increased usage of Bitcoin for reserves and international exchange, the legacy financial system is on the way out.
Assuming another ten-year bull cycle for gold, there are just over six years left in the current move and upside of 5x to 15x the current price. In this environment, cash flows for quality mining stocks will absolutely explode and provide investors with leveraged returns. At a modest projection of just 2x leverage, there exists the potential for 10x to 30x returns in gold mining stocks over the next 5 to 6 years!
This is precisely the type of asymmetric trade that we look for at Nicoya Research. If you would like to receive our top gold stock picks, real-time portfolio, monthly newsletter, and trade alerts, you can sign up for the top-rated Gold Stock Bull subscription here.
Read the original article here.
Nicoya Research.
Jason Hamlin is the founder of Nicoya Research and goldstockbull.com and has published investment research for over a decade. He previously worked in data analytics for Nielsen, the world’s largest market research firm, where he consulted to Fortune 500 companies including Nestlé, Johnson & Johnson and Del Monte. Hamlin’s investment philosophy takes into account political, historical and socio-economic factors to determine macroeconomic trends and isolate the sectors that stand to benefit. He then applies fundamental and technical analysis, as well as proprietary models, to find companies that are undervalued within those sectors. Hamlin is a contrarian, cycles investor and student of Austrian economics.

