
Source: Clive Maund for Streetwise Reports 10/09/2018
Technical analyst Clive Maund charts the markets and explains why he finds that the U.S. stock market is at an unprecedented overbought extreme.
There are times in life when being alarmed is actually a healthy defense mechanism that gives you an advantage over the many for whom “ignorance is bliss.” This is one of those times.
The U.S. stock market is now at a dangerous unprecedented overbought extreme, as the charts that we will look at in this update make abundantly clear, after years of being wafted higher by a combination of QE, ZIRP and stock buybacks, and latterly Trump’s tax bonanza, which has kept the party going by making windfall cash available for still more buybacks. However, with QE having already reversed into QT (Quantitative Tightening) and rates rising, the tide has already turned, and the vice is closing inexorably on the market, which will soon buckle and collapse back into an overdue and very necessary bear market that will serve to at least partially flush out the monstrous excesses of the past decade, before they come riding to the rescue with QE4. The magnitude of these excesses means that the bear market is likely to be anything but orderly, and it should be characterized by at least one big crash phase.
With respect to the timing of the onset of this bear market, which will likely start with a crash phase, because of the continually increasing pressure being exerted by QT and rising rates, we can expect the Republican party to pull out all the stops to prevent it caving in before the mid-term elections in just under a month, since a strong economy is one of the central planks of their campaign. What may happen is that we see wild volatility around the time of the election and then, regardless of the outcome, the market goes down soon after. However, we should keep in mind that October has long been notorious as the month when stock market crashes are most likely to occur, and the Deep State, which controls the Democratic Party, would love nothing better than to bring the market crashing down ahead of the mid-terms in an effort to discredit Trump and the Republicans and reduce their share of the vote.
The chief purpose of this article is to make it crystal clear to you, via the following charts, that the market is at a wild extreme and will soon tip into a savage bear market that will wipe out a lot of leveraged traders, so that you will not only be ready to take steps to protect yourselves, but for good measure position yourselves to turn this situation to your advantage.
We start by looking at a very long-term chart for the S&P500 index that goes all the way back to 1980, which gives us a Big Picture perspective. On this chart you need a magnifying glass to see the 1987 crash, which seems funny now, because it was big deal at the time. You can also see the glorious Clinton years bull market of the 1990s, which ended with the dotcom bust and then Greeny (Alan Greenspan) manning the monetary pumps to get things going again, which led to the property boom and subprime crisis that triggered the 2008 meltdown. After that all pretense at fiscal restraint vanished and we entered the era of full bore QE coupled with about 10 years of ZIRP, which caused debt to skyrocket and enabled massive leveraged speculation, which is what has caused the market to ascend to giddying heights, as stock buybacks rose to unsustainable extremes, kept going more recently by Trump’s tax cut.
So now what? Having created a situation of wild unsustainable extremes, the Fed has taken its metaphorical foot off the gas pedal and planted it on the brake, slowly at first to avoid rattling the markets, but slowly pressing down harder on it, as it desperately seeks to create “wiggle room” for the next crisis by raising rates and scale back its huge Treasury book. This is the cause of the liquidity drain, or Quantitative Tightening (QT). The “little guy” is, of course, blissfully unaware of all this as he gets sucked into the market at the top, believing all the hype about the “strong economy.” Actually the economy is strong; it’s the underpinnings that are anything but strong, like the continually expanding debt, and it won’t be Trump that is responsible when the whole thing comes crashing down—the causes of this impending crisis go back to way before Trump showed up on the scene. A massive liquidity drain is going on behind the scenes that will starve the market of funds to continue ascending and cause stock buybacks to shrivel as rates continue to rise—Jay Powell, the Fed Chair, has made it plain that he plans to carry on regardless with this policy, at least until it really hits the fan. Once players fully comprehend what is going on and that “the jig is up,” there will be a wild stampede for the exits, which is why the market is expected to not just drop, but crash—actually it would be odd, given the situation that is evolving, if it didn’t.
Now we will look at more charts which furnish additional evidence regarding the wild extremes that we are now at.
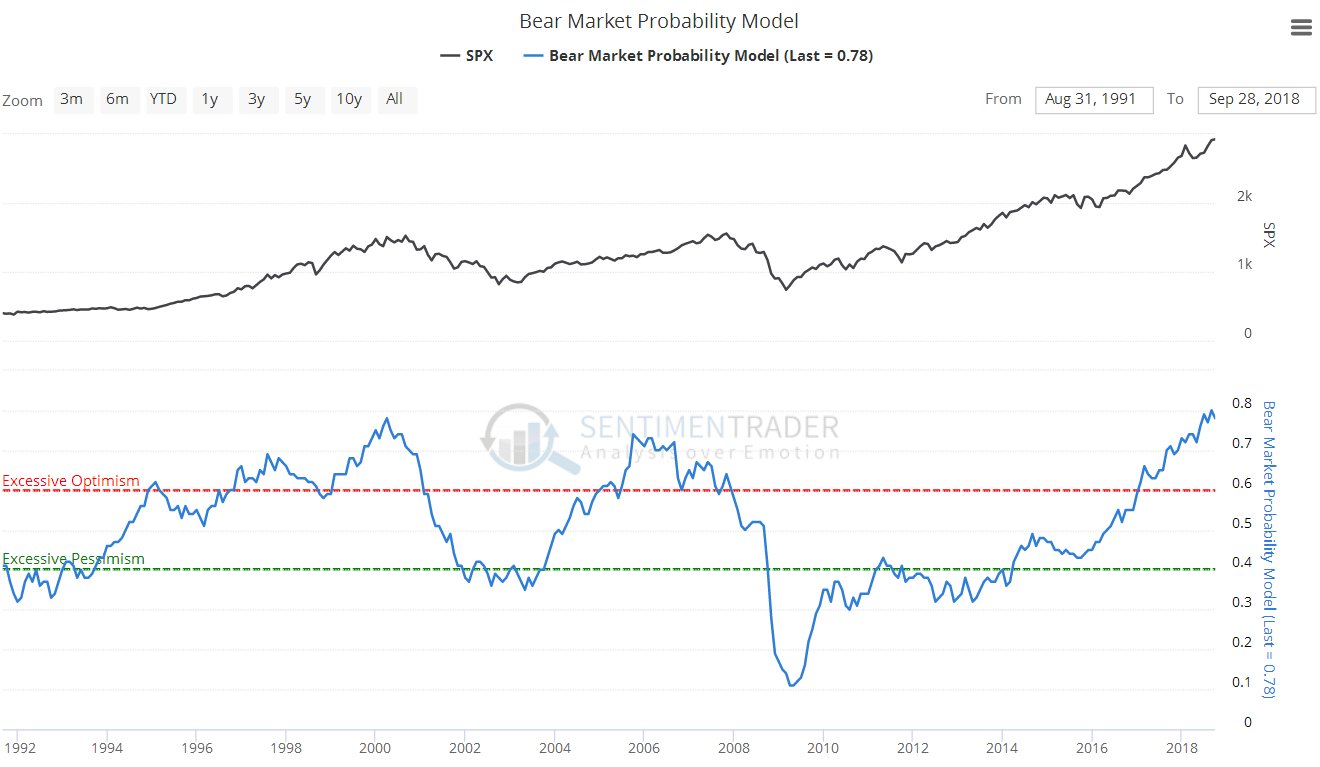
We start with the Bear Market Probability Chart, which is a very useful chart, because even a moron can understand it. The fact that a reading is at a high level does not necessarily mean that a bear market is imminent, but the higher the reading gets the more likely it is, and as we can see on this chart, it is now at readings that exceed by a significant margin those ahead of the 2000 top and the 2007 top, making the onset of a major …read more
From:: The Gold Report