
This post The Market’s Most Dangerous Month appeared first on Daily Reckoning.
Like a sudden fog stealing in from a clear sky, we are taken by surprise…
For Labor Day weekend is hard upon us. We had forgotten until a colleague reminded us.
The careful days of summer 2020 are running out… sand grains from time’s great hourglass.
Unlike most years, America’s youth will not be returning to their desks. Nor will its adults be returning to their salt mines.
Most will remain jailed down in their homes, withering, wallowing, wilting… under orders from their governor-jailers.
But our beat is money. And markets. To money and markets we therefore turn…
The “October Effect”
Many market monitors consider September a peacefulness before dreaded October.
The Panic of 1907, the Crash of 1929, “Black Monday” 1987 — all came hammering down in October.
October’s record is so scandalous, so felonious, it has even earned a title:
The “October effect.”
But is it true? Does October truly merit its blackened name?
Today we haul the accused into the dock, interrogate its record… and announce a verdict.
If innocent, what month then is the market’s most heinous brigand, its greatest thief?
Answers to follow. Let us first pronounce judgment on today’s proceedings…
Just Like March
Today’s verdict is unkind.
After the grandest month in 34 years, we learn once again that stocks also fall. Today they fell plenty hard.
Not since the dark, pandemic days of March did stocks endure such a walloping.
The Dow Jones came 807 points down today. The S&P lost 125 points. The Nasdaq, meantime, plunged 598 points — the most harrowing fall of the three, percentage-wise.
Technology stocks as Apple, Facebook, Amazon and Netflix, all were routed today.
These are the cart horses that have been pulling the rest of the market along.
When they go backward — when they push rather than pull — the market goes with them.
These horses pushed today.
We should not be surprised when we consider present market valuations…
Valuations Are Stretched to the Maximum
Greg Branch is an adviser with 1847 Financial. From whom:
When we look at Tesla, it’s trading at a market cap of $455 billion which is 10 times what General Motors is trading at. And so we have to wonder can fundamental analysis sustains some of these valuations? When we look at Zoom, it’s trading at more than IBM and at a P/E ratio of over 500 times versus IBM at 15 times. What I think is happening is investors are starting to scrutinize the valuations a bit more.
Adds Alec Young — chief investment officer with Tactical Alpha LLC:
The market was overbought, there were too many people chasing the tech names… The valuations have been stretched.
Stretched?
Valuations are tied tortured upon the rack, moaning, squealing; joints, tendons, ligaments giving way as Mr. Powell turns the crank… like rubber bands stretched to the critical point.
A Dangerous Milestone
Yale University’s Professor Robert Shiller engineered the “Shiller CAPE” ratio. As described by analyst William Bengen:
This metric represents a P/E for all the companies in the S&P 500, based on their current stock prices and the previous 10 years of inflation-adjusted earnings. It seeks to “smooth out” short-term fluctuations in earnings and come up with a P/E representative of the true earning power of the companies involved.
Last month — for merely the fourth occasion in its rich history — Shiller’s CAPE ratio exceeded 31. The three previous instances were:
Shortly prior to 1929’s Black Tuesday… between 1997 and 2001… and from late 2017 through October 2018.
You are aware of the Crash of ‘29. You are similarly aware of 2001’s dot-com hells.
But do you recall that the stock market took a severe stagger in December 2018 — before Mr. Powell threw open the liquidity flood gates in January 2019?
It did. We recall it well.
But returning to the question of the hour: Is October the menacing scourge we’ve all been led to believe?
History says the answer is… no.
October’s Threat Is Overrated
October’s bankrupt reputation likely owes to a string of sour luck. And its conviction was based heavily upon scattered, circumstantial evidence.
Explains Stephen Williamson, former vice president of the St. Louis Federal Reserve:
Stock market crashes have occurred sufficiently infrequently in history that there is not enough evidence on when they are more likely to occur.
The gentlemen and ladies of Yardeni Research further vindicate October. The average October market return is not negative in the least, they inform us.
It is, in fact, a positive 0.4%. A slender gain, yes — but a gain.
Meantime, Investopedia informs us that more bear markets ended in October than began in October.
Downturns in 1987, 1990, 2001 and 2002 swung around in the year’s 10th month.
We must therefore conclude that an innocent man has been pitched into infamy… and packed off to the gallows on a wrongful charge.
But if October is not the depraved menace many believe, does another month rise in its place?
The record argues that yes, another month is the true menace. Which month?
September — this month.
The “September Effect”
“Since the Dow Jones industrial average was created in the late 1890s,” financial columnist Mark Hulbert notes, “September has produced an average loss of 1.1%.”
“The 11 other months of the calendar,” Hulbert adds, “have produced an average gain of 0.8%.”
Nor do one or two renegade Septembers explain it, says Hulbert:
“On the contrary, the month has an impressively consistent record at or near the bottom of the rankings.”
September’s ill luck covers both the Dow Jones and S&P… incidentally.
Yahoo! Finance:
According to LPL Financial, September has been the worst-performing month for markets, on average, since 1950. The S&P 500 has dropped about 1% on average that month since 1950, LPL Financial data shows. The only other month to record a drop on average (and a minuscule one at that) going back to 1950 is August.
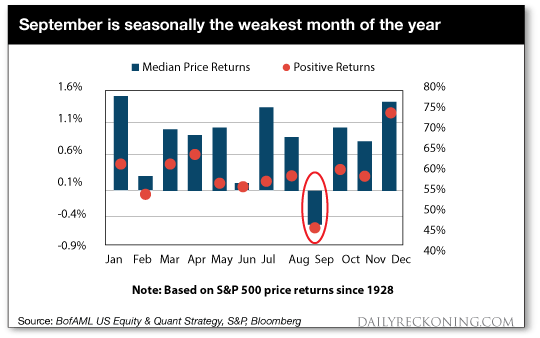
Bank of America Merrill Lynch strategist Savita Subramanian has pulled together the S&P’s median September return since 1928.
The facts confirm it. September is the great thief of investor money, not October.
Here is his evidence — the red-handed evidence:
Next to September, October is a heaven; a month of nectar, of honey.
And so the time has come to correct a cruel and libelous wrong…
It is time to replace the “October effect” with the infinitely more deserving “September effect.”
But let us stow away all further talk of Septembers past. What about September present?
A Warning From Mark Twain
The stock market went amok in August — again, its swellest month in 34 years.
Yet it was a case of too much. And a case of too fast.
Thus you have today’s trouncing.
But do we hazard our own prediction of September doom?
Of course we do not. We have choked down crow too many times — without salt.
“Sometimes right, sometimes wrong and always in doubt, we just try to connect the dots,” as our co-founder Bill Bonner styles it.
We are but three days into the month. And we would not be one lick surprised if the market resumes its winful — if sinful — ways.
But if history is a reliable barometer… September is one of the most dangerous months to speculate in stocks.
Along with, as the great scalawag Mark Twain noted:
“July, January, April, November, May, March, October, June, December, August — and February.”
Regards,

Brian Maher
Managing Editor, The Daily Reckoning
The post The Market’s Most Dangerous Month appeared first on Daily Reckoning.