On Wednesday the gold price regained some of its footing after the unceremonious $100 plunge to below $2,000 an ounce yesterday. Gold for December delivery closed at $1,926 an ounce in New York after falling as low as $1,874 earlier in the day.
Action on financial markets shifted to US stocks with the S&P500 briefly trading above its all-time closing high of 3,386 set in February. The Dow Jones ended at 27,976, back to within shouting distance of its peak, also reached in February.
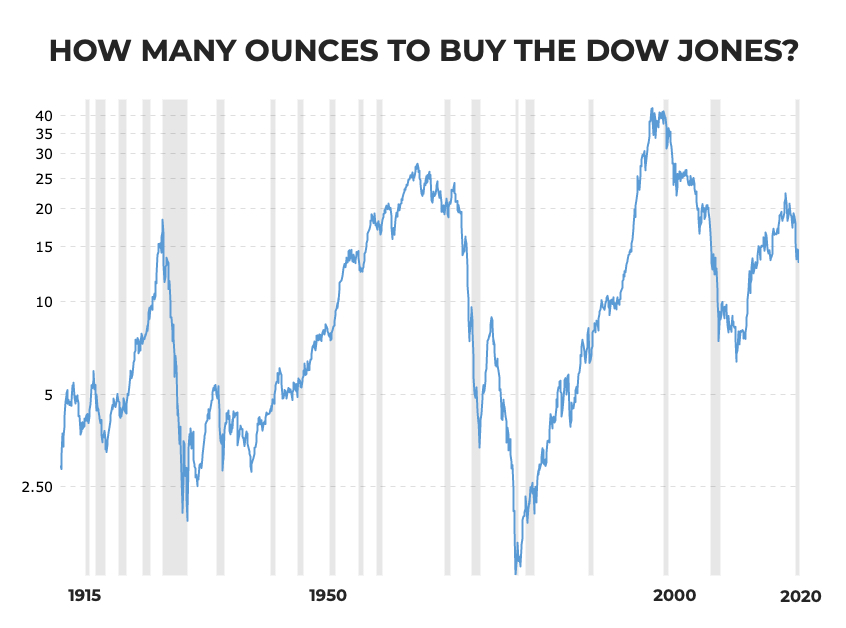
This 105-year chart of the blue chip index from Macrotrends tracks how many ounces of gold it would take to buy the Dow over any given month.
Previous cycle lows have been 1.9 ounces in February of 1933 and 1.3 ounces in January of 1980 when gold in inflation-adjusted terms hit an all-time high of roughly $2,500 an ounce
In the late nineties and early 2000s when gold was languishing in the $200s and $300s it took around 40 troy ounces to buy the Dow index.
Previous cycle lows have been 1.9 ounces in February of 1933 and 1.3 ounces in January of 1980 when gold in inflation-adjusted terms hit an all-time high of roughly $2,500 an ounce.
When the nominal price of gold climbed $1,900 for the first time in August 2011, the ratio was a relatively dear 6.4.
On Wednesday the Dow-Gold ratio based on closing levels was at 14.5, last hit in October 2016 when gold averaged $1,265 an ounce. At its brief but glorious intraday summit of $2,089.20 hit last Friday, it still takes 13.4 ounces.
Is gold overvalued at these levels? Has the rise been too far, too fast? Are gold bugs (once again) guilty of irrational exuberance?
In comparison to stock markets, the answer is a resounding no.

