Extraordinary times call for extraordinary measures, as they say, and the past number of days have been nothing if not total confirmation of that adage.
As of Monday morning, the number of confirmed coronavirus cases in the U.S. stood at more than 143,000, with New York City appearing to have become the new global epicenter of the pandemic.
Hospitals in the hardest-hit areas of the countries “have passed a tipping point,” writes the Wall Street Journal. New York has had to quickly set up makeshift treatment centers and morgues in Central Park and elsewhere to meet the spread of infection.
In light of the surge in new cases, President Donald Trump extended social distancing guidelines to April 30 after earlier questioning whether the “cure” was worse than the problem.
To be clear, the “cure” has taken an unprecedented toll on the U.S. and world economies.
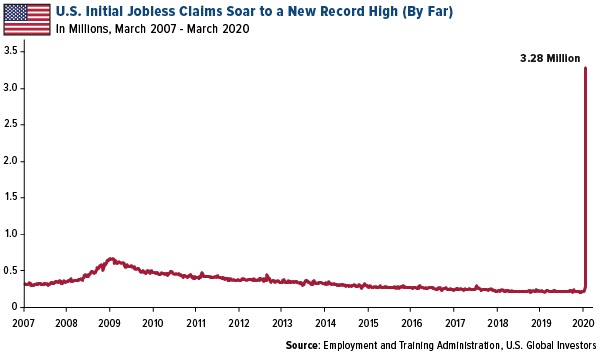
Initial jobless claims soared to a new record high of 3.28 million people as layoffs around the country have accelerated. As recently as February, the weekly figure was little more than 200,000, a historically low number, showing just how rapid the economic deterioration has been. The tidal wave of people seeking jobless benefits of last week was so great, in fact, that state-run unemployment websites reportedly couldn’t handle the traffic and were crashing.
In a press conference following the data’s release, Treasury Secretary Steven Mnuchin called the jobless number “not relevant,” saying that the president “is protecting those people.”
Indeed, “protection” is on the way, with Congress and the Federal Reserve both opening the stimulus floodgates as we’ve never seen before.
Trillions in Assistance Headed to U.S. Families and Businesses, Including Airlines
On Friday, Congress approved and President Trump signed into law a $2.2 trillion emergency economic stimulus package, the largest in U.S. history, meaning sometime soon, most American adults will be receiving a one-time payment of $1,200 in cash. (The median personal income in the U.S. as of last year was around $40,000, well below the $75,000 cutoff point to receive the full amount.) On top of that, families will receive $500 per child.
Remarkably, the final vote in the Senate for the landmark bill was a unanimous 96 to 0, which demonstrates to me just how united lawmakers are in getting help to struggling families and businesses. In 2009, when the Senate voted in favor of the $787 billion stimulus bill to mitigate the impact of the financial crisis, the tally was 60 to 38––just barely enough to pass.
Included within the stimulus package is $50 billion in earmarked liquidity for coronavirus-hit domestic airlines. This includes $25 billion in loans and guarantees for passenger carriers and $25 billion in direct grants.
I’m pleased to see that airline stocks bounced off their lows as deep-value investors such as Warren Buffett have sought discounted exposure to an industry that I believe most people consider essential in today’s interconnected world. Some 2.8 million passengers flew every day in and out of U.S. airports in 2019, according to the Federal Aviation Administration (FAA). The industry also generated a whopping 10.6 million U.S. jobs, or 1 out of every 15 jobs.
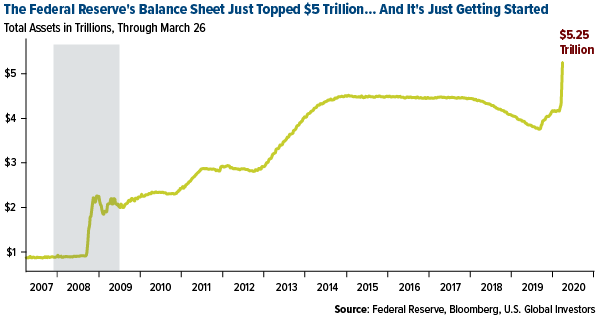
As for the Federal Reserve, the central bank is poised to “spray trillions of dollars into the U.S. economy,” according to Bloomberg. As of March 26, the size of the Fed’s balance sheet had shot up to a never-before-seen $5.25 trillion, far beyond anything it did in the months and years following the financial crisis.
Time to Buy the Gold Miners?
As I’ve discussed plenty of times before, such massive levels of money printing has historically been supportive of gold. In September 2011, when the Fed was rapidly expanding its balance sheet, the precious metal’s price hit its all-time high of $1,900 an ounce.
With real rates already below 0 percent, the Fed has little choice right now than to jump directly to extreme measures. That means loading up on Treasuries and mortgage-backed securities (MBS) “in the amount needed,” as the central bank put it in a press release dated March 23.
I believe this policy will once again be constructive for gold, and so it may be prudent to consider buying not just physical gold, but also the gold miners.
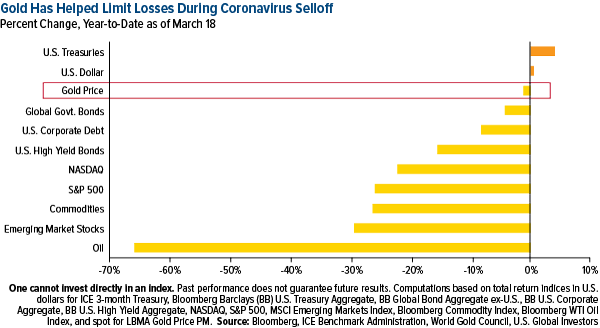
The strategy has been a good one so far this year, as you can see in the chart below. Compared to other major assets, gold’s decline was minimal year-to-date through March 18, helping investors limit net losses in their portfolios.
As for gold mining companies, shares have fallen with the broader stock market, but I believe producers are beginning to look very attractive as investors take note of the revenue and free cash flow they’re generating because of higher metal prices. Last Monday, the price of gold ended the day up $83 an ounce, or 5.6 percent––the biggest single-day dollar amount gain in the history of gold trading. The previous record was set on October 25, 2011, when it advanced $70 an ounce.
We’ll see the final results when gold and precious metal miners report quarterly earnings, but if you’re asking for my opinion now, I think they’re in a good position to beat expectations.
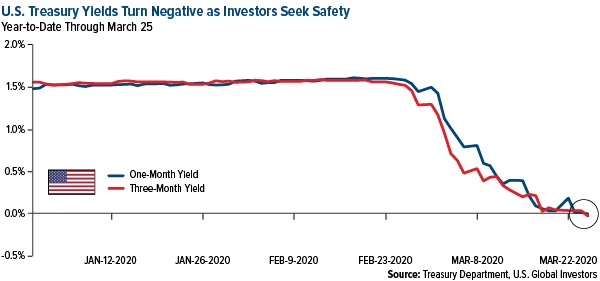
Short-term Treasury yields dipped below 0 percent last Monday, meaning if you held them to maturity, you would be guaranteed a loss. I believe investors seeking a safe haven right now would be better off buying gold and gold mining stocks.
Once-in-a-Lifetime Buying Opportunities
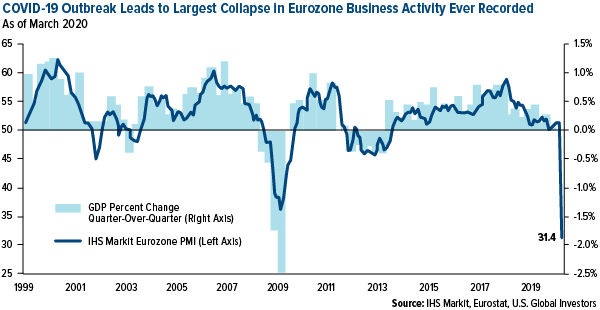
And if it’s equities you’re looking for, there couldn’t be a better time than now to go bargain hunting. Business activity in the eurozone collapsed at the fastest rate ever recorded by IHS Markit in March. The composite purchasing manager’s index (PMI), which includes both the manufacturing and services sectors, plunged from 51.6 in February to 31.4, the lowest reading on record since the series began––lower even than during the global financial crisis.
As a reminder, this is preliminary data. We’ll have the final PMI results on Wednesday, but I don’t expect to see much change.
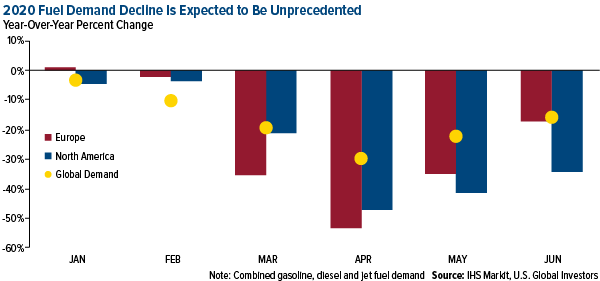
Take a look at the impact the virus may have on global fuel demand. IHS Markit has modeled out what it believes will be fuel consumption declines on a scale that’s never occurred before, due to widespread restrictions on travel that’s deeply affected commerce. Although this is a global pandemic, “demand destruction will be most severe in Europe and North America,” writes Rob Smith, director of IHS Markit’s Refining and Marketing group. In April, European and North American fuel demand could drop by half (or more!) compared to the same month in 2019.
“Most airlines are culling their flight schedule by upwards of 50 percent,” Smith says, “with most European airlines cancelling better than 90 percent of their flights. And speaking of Europe, commuter vehicle traffic in heavily affected cities like Milan, Paris and Madrid has fallen as much as 80 percent after lockdown measures took effect. Meanwhile, vehicle mileage in the U.S. is “only” expected to contract by 55 percent.”
“The global auto industry,” IHS Markit continues in a press release dated March 26, “is expected to witness an unprecedented and almost instant stalling of demand in 2020, with global auto sales forecast to plummet more than 12 percent from 2019, to 78.8 million units.”
As I said earlier, these could be attractive buying opportunities!
Interested in learning more on the gold market? Watch my interview with Investing New Network (INN) by clicking here!
All opinions expressed and data provided are subject to change without notice. Some of these opinions may not be appropriate to every investor.Some links above may be directed to third-party websites. U.S. Global Investors does not endorse all information supplied by these websites and is not responsible for their content.
The Bloomberg Barclays US Aggregate Bond Index is a broad base, market capitalization-weighted bond market index representing intermediate term investment grade bonds traded in the United States. The Bloomberg Barclays Global Aggregate Index is a flagship measure of global investment grade debt from twenty-four local currency markets. This multi-currency benchmark includes treasury, government-related, corporate and securitized fixed-rate bonds from both developed and emerging markets issuers. The Bloomberg Barclays US Corporate Bond Index measures the investment grade, fixed-rate, taxable corporate bond market. The Bloomberg Barclays US Corporate High Yield Bond Index measures the USD-denominated, high yield, fixed-rate corporate bond market. The MSCI Emerging Markets Index captures large and mid cap representation across 26 Emerging Markets (EM) countries. With 1,401 constituents, the index covers approximately 85% of the free float-adjusted market capitalization in each country. The Bloomberg Commodity Index is made up of 22 exchange-traded futures on physical commodities. The index represents 20 commodities, which are weighted to account for economic significance and market liquidity. The Bloomberg WTI Crude Oil Subindex is a single commodity subindex composed of futures contracts on crude oil. It reflects the return of underlying commodity futures price movements only and is quoted in USD. Free cash flow (FCF) represents the cash a company generates after accounting for cash outflows to support operations and maintain its capital assets.The Purchasing Manager’s Index is an indicator of the economic health of the manufacturing sector. The PMI index is based on five major indicators: new orders, inventory levels, production, supplier deliveries and the employment environment.

