Another year, another Thanksgiving. I hope all of my American friends and readers had the chance to spend some quality time with family as we begin the busy holiday shopping season. The leading retail trade group expects sales in November and December to increase as much as 4.2 percent over last year, for a total potential value of $730.7 billion.
Part of this growth is due to the market selloff that happened at the end of 2018. But there’s more to the story than that.
As I recently told you, the U.S. purchasing manager’s index (PMI), a leading indicator of economic activity, turned up for the third straight month in November. This is a good reflection of healthy demand, and a possible signal of further upside. There’s still a month left to 2019, and yet stocks are already up an incredible 28 percent.
Below are some more need-to-know numbers you might have missed from this last week.
$0.01 Increase for a Thanksgiving Dinner
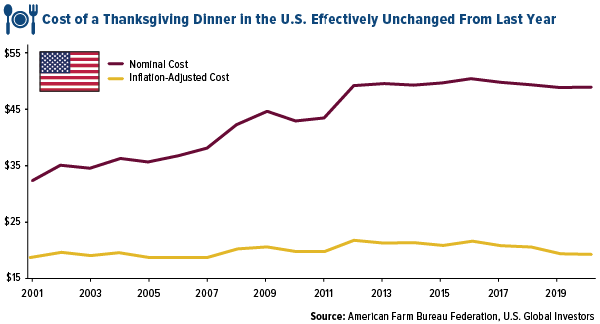
One of the more interesting ways to measure U.S. inflation is by tracking the annual price of a typical Thanksgiving dinner for 10. That’s what the American Farm Bureau Federation (AFBF) has been doing for the past 34 years, and in its most recent survey, the group found that the total cost was effectively flat, rising only $0.01—from $48.90 in 2018 to $48.91 today. That’s as little as $5 per person. As Evercore ISI pointed out in a research note this week, the cost of a Thanksgiving dinner is lower now than it was eight years ago—the first time we’ve seen that since 1947.
“Americans continue to enjoy the most affordable food supply in the world,” commented AFBF Chief Economist John Newton.
55 Million Travelers
If you traveled at all last week, I hope you planned ahead. An estimated 55 million people in the U.S. were expected to hit the road or take to the skies this Thanksgiving season, up 1.6 million people, or nearly 3 percent, from last year, according to the American Automobile Association (AAA). That’s the most people since 2005. Looking at air travel alone, some 4.45 million Americans are expected to fly on domestic airlines, an annual increase of 4.6 percent.
$10 Billion Stake in U.S. Airlines
Speaking of airlines… In last week’s equity and bond report, Murenbeeld & Co. analysts Brian Bosse and Chantelle Schieven brought to our attention a lesson inspired by Warren Buffett—namely, investors must change when the facts change.
As recently as 12 years ago, Buffett was famously warning investors to steer clear of the airline industry, which had been destroying capital at least since deregulation in 1978. After the industry consolidated and restructured a couple of years later, however, airlines have committed themselves to capacity growth discipline and returning value to shareholders.
“When an industry changes from reliably destroying shareholder capital into providing reliable positive returns which create economic value, then astute investors should take notice,” Boose and Schieven write.
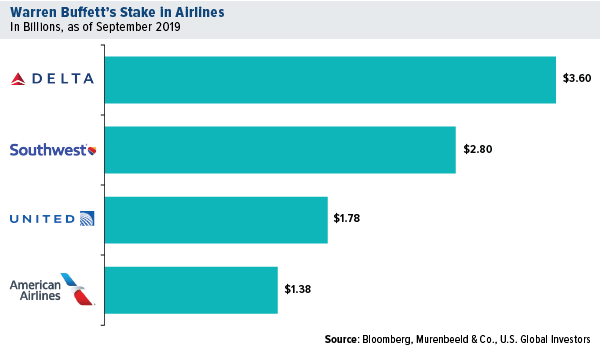
Buffett certainly took notice, and today his stake in the “Big Four” carriers stands at just under $10 billion.
Another industry that Murenbeeld & Co. call out for transforming from “money wasters to money spinners”? The mining industry.
$3.7 Billion Deal
Like airlines before it, the gold mining industry is seeking to improve shareholder value through consolidation, among other means. Last week, we learned that Kirkland Lake Gold will be buying rival Detour Gold in an all-stock deal valued at C$4.9 billion ($3.7 billion). This is just the latest deal in the current wave of consolidation that began last year with the Barrick-Randgold deal and Newmont-Goldcorp deal.
$12 Trillion in Negative-Yielding Debt
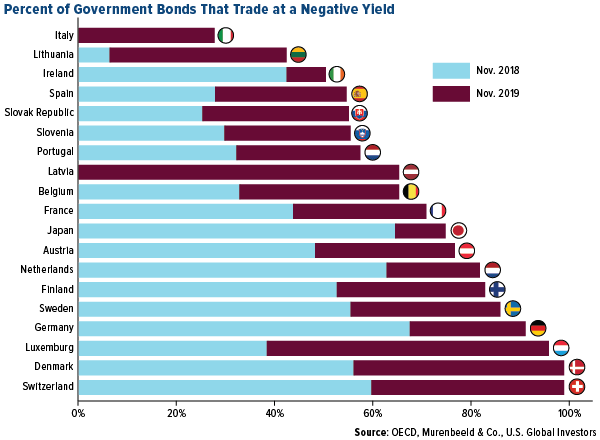
One of the key drivers of the price of gold this year has been the surging mountain of negative-yielding government bonds. According to Murenbeeld, this amount, as of November, is a mind-boggling $12 trillion. That’s down from $17 trillion in August, but if you look below, you’ll see that more than half—and, in some cases, close to 100 percent—of some economies’ outstanding debt is trading at negative yields.
16,700 Percent Return in 50 Years
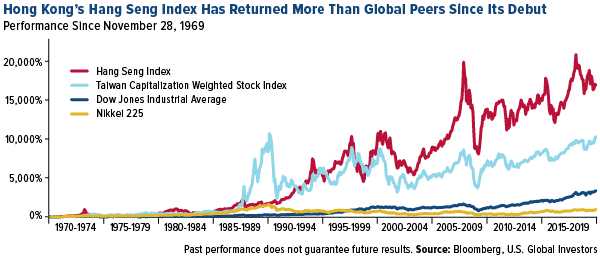
Last week marked 50 years since the debut of the Hang Seng Index, the widely quoted gauge of the 50 largest companies trading in Hong Kong. From its launch in November 1969, the Hang Seng is up some 16,700 percent, making it the world’s best-performing stock index by a wide margin.
Originally intended as a measure of local firms, the Hang Seng has increasingly become a proxy of China’s economy.
Today, about half of the Hang Seng is represented by mainland Chinese heavyweights such as Tencent, China Mobile and Geely Automotive. Shares of Chinese e-commerce giant Alibaba began trading in Hong Kong for the first time last week. With a market cap of 4 trillion Hong Kong dollars ($513 billion), Alibaba is already the city’s biggest stock, meaning we’ll likely see it join the Hang Seng, possibly as soon as its next rebalance.
Again, I hope everyone had a blessed holiday weekend! I often say that having gratitude improves your way of looking at the world. It’s important that we take stock not only in our finances but also the people who matter most, from family and friends to coworkers and business associates.
All opinions expressed and data provided are subject to change without notice. Some of these opinions may not be appropriate to every investor. By clicking the link(s) above, you will be directed to a third-party website(s). U.S. Global Investors does not endorse all information supplied by this/these website(s) and is not responsible for its/their content.
The Purchasing Manager’s Index is an indicator of the economic health of the manufacturing sector. The PMI index is based on five major indicators: new orders, inventory levels, production, supplier deliveries and the employment environment.
The Hang Seng Index is a capitalization-weighted index of 33 companies that represent approximately 70 percent of the total market capitalization of The Stock Exchange of Hong Kong. The Taiwan Weighted Index contains all Taiwan Stock Exchange issues (560 common stocks). It is a market-capitalization weighted index. The Dow Jones Industrial Average is a price-weighted average of 30 blue chip stocks that are generally leaders in their industry. NIKKEI 225 Index is a price-weighted index of 225 top-rated Japanese companies listed in the First Section of the Tokyo Stock Exchange.
Holdings may change daily. Holdings are reported as of the most recent quarter-end. The following securities mentioned in the article were held by one or more accounts managed by U.S. Global Investors as of 9/30/2019: Delta Air Lines Inc., Southwest Airlines Co., United Airlines Holdings Inc., American Airlines Group Inc., Kirkland Lake Gold Ltd., Detour Gold Corp., Newmont Goldcorp Corp., Geely Automobile Holdings Ltd.


