
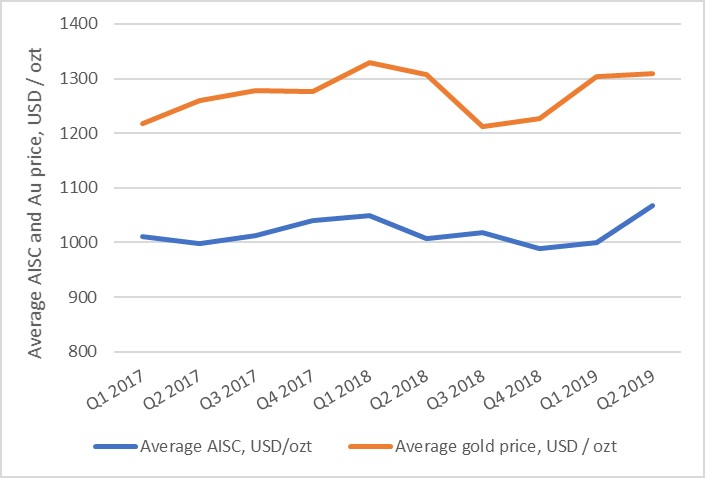
In the second quarter of 2019, the global gold market continued to
recover from the two-year lowest average price point of $1,213/ozt recorded in
Q3 2018, rebounding to $1,310/ozt in Q2 2019, the third consecutive quarter of
growth.
MINING.COM analysed the effect of the gold price on the gold mining industry using data from sister company Mining Intelligence’s proprietary Data Application. The data we used represents companies reporting quarterly production and listed on the following stock exchanges: TSX (+TSX-V), ASX, LSE (+LSE-AIM), NYSE, and JSE.
We looked at four metrics: quarterly gold production, all-in sustaining costs, operating income and capital raisings. The data indicates the following: Reported global gold production for Q2 2019 was ~15.4 Mozt, or up about 3% compared to Q1 2019 and down ~1% compared to Q2 2018.
Global average all-in sustaining costs rose by 7%, from $1,000/ozt in Q1
2019 to $1,068 in Q2 2019. Overall, gold producers have not managed to keep
costs under control. Major gold producers’ global aggregated quarterly
operating income did not follow rising gold price and shrank by 21%.
Capital raisings completed by gold producers, developers, and explorers were up by 195% from Q1 2019 to Q2 2019 indicating return of investors’ confidence in the gold mining industry.
Reported global gold production
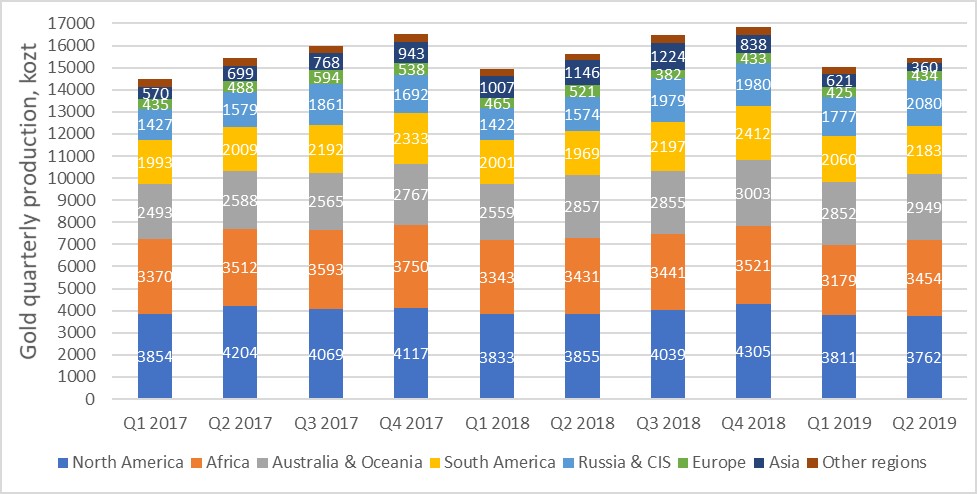
For the Q2 ending June 30, 2019, global reported gold production
totalled ~15.4 Mozt, or up ~3% compared to the previous quarter and down ~1%
compared to Q2 2018 (Figure 1). Production increased in all major regions
except North America and Asia. North America was the largest gold producer (3.8
Mozt), followed by Africa (3.5 Mozt), and Australia & Oceania (3 Mozt).
The three regions that contributed most to the 3% quarter-on-quarter improvement
in global gold output were Russia & CIS (+303 kozt, or up 17%), Africa (+275
kozt, or up 9%), and South America (+123 kozt, or up 6% from Q1 2019).
Russia was in the spotlight in Q2 2019 as reported quarterly gold
production surged by 18% in this region, from 1,264 kozt in Q1 2019 to 1,492
kozt in Q2 2019. Seasonal alluvial gold mining and production increase at new
and expanding operations have contributed most to the overall success of local
gold industry.
After a 10% decline in Q1 2019, gold output in Africa was up 9% in Q2
2019, thanks to a significant production increase in South Africa (+18%) and
other countries of the continent. Ghana, Africa’s biggest gold producer, increased
gold output from 700 kozt in Q1 to 743 kozt in Q2 2019, but runner up South
Africa is closing the gap.
Production in Asia took yet another nosedive — dropping 42% due to significant decrease in gold output at Indonesia’s Grasberg mine as this legendary mine is still in transition from open-pit to underground operations.
Seven out of the top 10 biggest gold mines reported a production increase with only three of them recorded a decline (Table 1).
Despite 7% drop in output, Barrick’s Goldstrike production center in Nevada, USA, retained the world’s lead gold operation status (Muruntau mine is excluded due to lack of data), well ahead of its competitors.
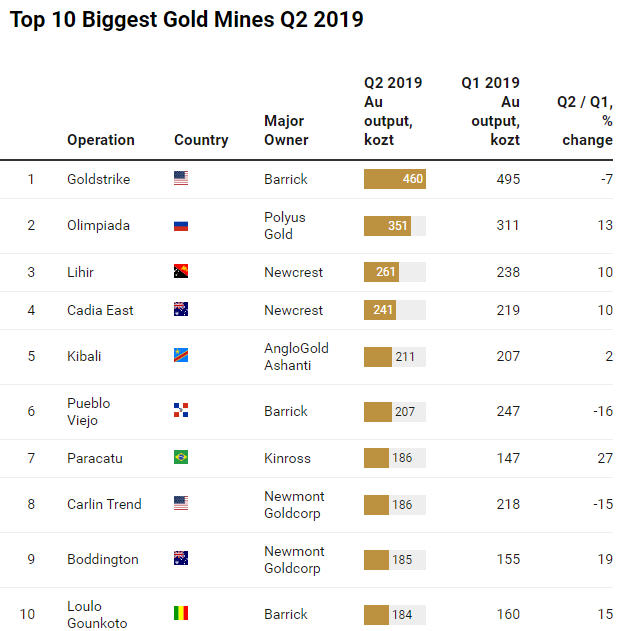
Second and third in this ranking are Polyus Gold’s gigantic Olimpiada mine in Russia (351 kozt) and Newcrest’s Lihir mine in Papua New Guinea (261 kozt). Former world’s biggest Freeport’s Grasberg gold mine (Indonesia) and Yamana / Agnico Eagle jointly-owned Canadian Malartic mine (Canada) dropped out of the top 10 list while Kinross’ Paracatu mine (Brazil) and Newmont Goldcorp’s Boddington mine (Australia) entered the ranking landing on the seventh and ninth positions, respectively.
Reported global average quarterly all-in sustaining costs
Global average all-in sustaining costs (AISC) rose by 7%, from $1,000/ozt in Q1 2019 to $1,068 in Q2 2019 (Figure 2). This indicates that the trend on keeping costs under control observed over the previous four quarters, has reversed. Despite this, in Q2 2019, seven out of the top 10 lowest cost mines further decreased their AISC compared to Q1 2019 (Figure2).
With $318/ozt recorded in Q2 2019, Kirkland Lake’s Fosterville mine in
Australia was the lowest cost gold operation for the third consecutive quarter
measured by AISC. Fosterville’s ore grade was 40 grams of gold per tonne of
milled ore, making this the world’s highest-grade major gold mine in Q2 2019.
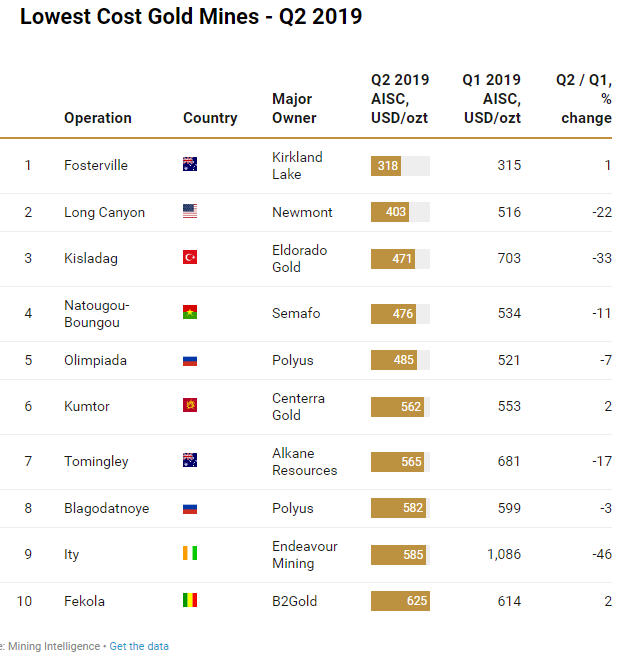
Fosterville was followed by Newmont Goldcorp’s Long Canyon mine ($403/ozt)
in the United States, and Eldorado Gold’s Kisladag mine ($471/ozt) in Turkey.
Kisladag (Turkey), Tomingley (Australia), Blagodatnoye (Russia), Ity (Ivory
Coast) and Fekola (Mali) mines entered the top 10 lowest cost gold mines
ranking in Q2 2019, while Mt Carlton (Australia), Kainantu (Papua New Guinea),
Pueblo Viejo (Dominican Republic), Natalka (Russia) and Merian (Suriname) mines
have left this competition, at least for the time being.
Reported operating income
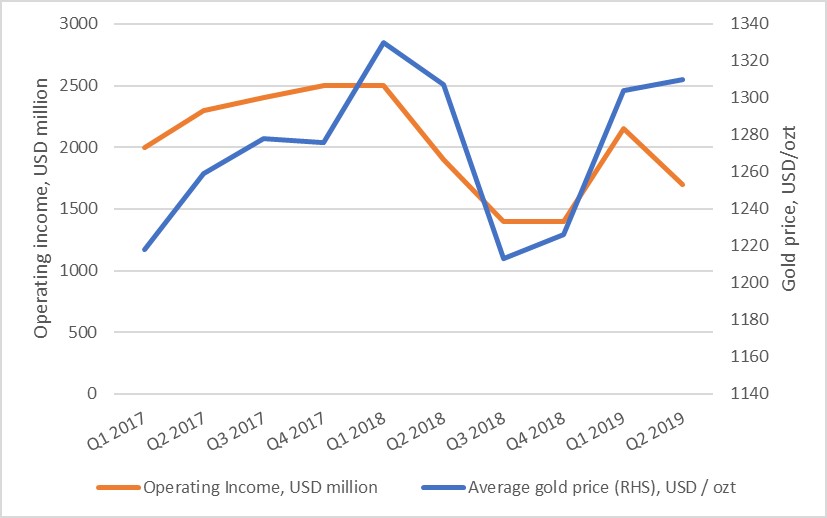
Major gold producers’ global aggregated quarterly operating income did not follow rising gold price and dwindled by 21%, from $2,150 million in Q1 2019 to $1,700 in Q2 2019 (Figure 3). Overall, companies have not managed to keep costs under control and, despite improved gold market, aggregated financial performance of gold mining industry has deteriorated.
Completed capital raisings
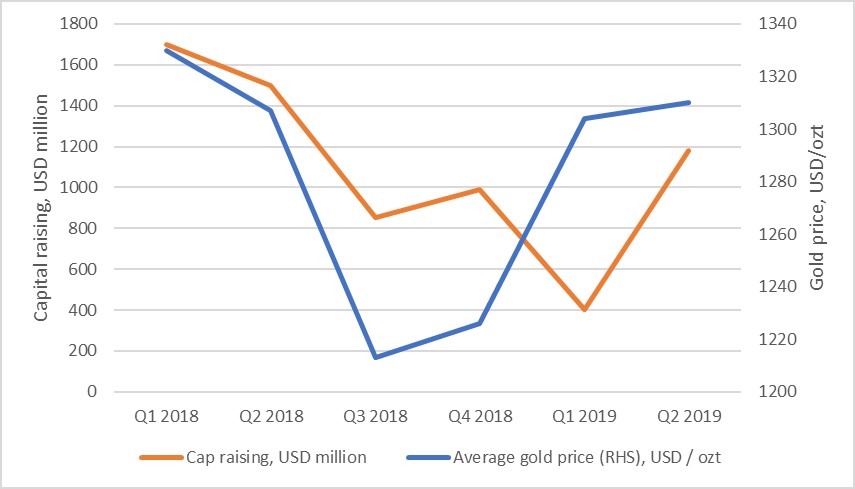
The strength of equity markets is a barometer of investor confidence. The amount of capital raised through equity placement directly reflects the sentiment in the mining industry. This indicator shows that in Q2 2019, investors’ confidence in gold mining industry returned, with gold producers, developers, and explorers raising 195% more capital at major exchanges compared to Q1 2019 (Figure 4).
Note: quarterly gold production reported by publicly-traded companies
accounts for about 65-70% of total global gold production and can be considered
an indicator of the overall state of the global gold mining industry.
Mining Intelligence focused on primary gold operations’ AISC, i.e. mines
where gold contributed to 90% and more of revenues from operating activities
generated during the quarter. The ranking excludes tailings re-processing
operations, mines where the precious metal is produced as a by-product, and
operations where companies report gold-equivalent output.