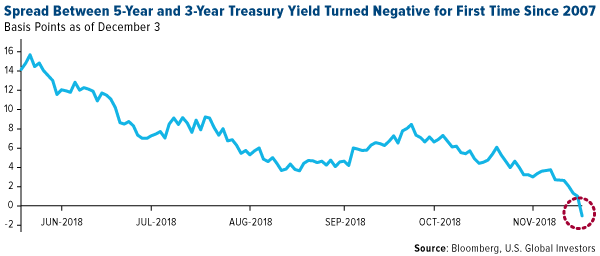
One of the most reliable indicators of an economic slowdown just flashed a warning sign this week. On Monday, the yield curve between the five-year Treasury yield and three-year Treasury yield inverted, or turned negative, for the first time since 2007. What this means is the shorter-maturity bond now pays more than the longer-maturity bond, suggesting investors believe the government is less likely to service the debt it owes in three years than in five years. Such an inversion has historically portended a recession sometime in the next six to 24 months.
Meanwhile, the more closely watched spread between the 10-year yield and two-year yield, though positive, sat at a lowly 15 basis points on Monday, the flattest it’s been in more than 11 years. All nine recessions since 1955 have been preceded by an inversion of the 10-year and two-year Treasury yields.
I believe the flattening yield curve is just one among a number of signs that we’re entering a more risk-off investing environment (one in which investor appetite for riskier assets, such as stocks, decreases). The recent trade war ceasefire between the U.S. and China is encouraging, but challenges still persist, including rising U.S. interest rates, Brexit, skyrocketing debt and a purchasing manager’s index (PMI) that’s steadily weakened over the past eight months.
All things considered, I think it might be time for investors to consider getting more defensive as we proceed further into the later stages of this business cycle, one of the longest in U.S. history. That means making sure you have exposure to assets that have historically done well during slowdowns in the economy and capital markets. Among my favorite are precious metals, particularly gold, and short-term, tax-free municipal bonds.
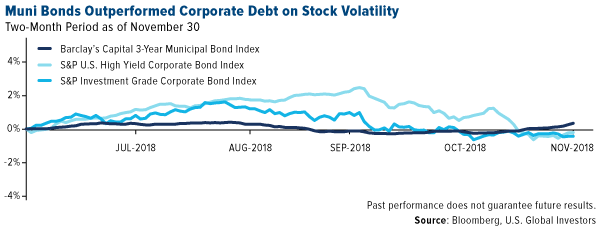
Municipal Bonds Have Outperformed Higher-Risk Corporate Bonds
Municipal bonds might have a reputation for being “boring,” but personally I don’t find anything boring about potentially limiting losses in my portfolio. That’s precisely what munis managed to do lately as stocks tumbled, many of them entering correction and even bear market territory. Short-term state and local debt, as measured by the Barclays Capital 3-Year Municipal Bond Index, delivered 0.3 percent in the two months ended November 30, while high-yield and investment-grade corporate debt lost 0.2 percent and 0.4 percent, respectively. Even the riskiest munis gained, according to Bloomberg data, helping investors staunch some of the declines they might have felt in their equity allocation.
Speaking of risk, munis have historically had a much lower rate of default than corporate bonds. Between 1986 and 2016, the muni default rate was only 0.04 percent, whereas corporates had one 50 times higher at 2.03 percent, according to Moody’s. On top of that, munis provide income that’s tax-free at the federal and often state levels, unlike corporate securities, which are subject to taxes.
Consider the Near-Term Tax Free Fund (NEARX)
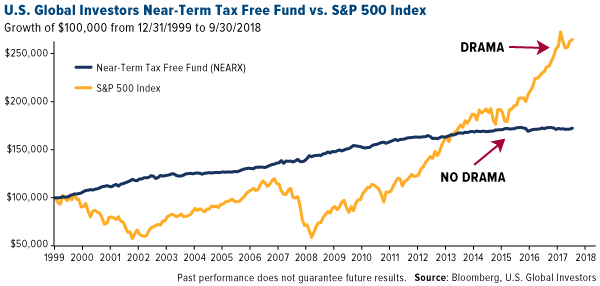
Two months is admittedly a small sample size, so let’s take a longer view of munis’ performance using our Near-Term Tax Free Fund (NEARX). As you can see below, if you had invested $100,000 in NEARX and in an S&P 500 Index fund back in 1999, it would have taken more than 13 years for the S&P fund to catch up to and surpass NEARX.
See standardized performance by clicking here.
While the market lost as much as 40 percent on two separate occasions, during the tech bubble and financial crisis, our short-term muni bond fund stayed relatively stable. That’s because munis, unlike stocks, favor safety and liquidity over growth—a strategy I believe investors should really consider now that there are signs of a looming equity slowdown.
I like to call this strategy “no drama” investing.
Even in a rising interest rate environment, I think NEARX can help investors avoid volatility in the stock market. And remember, this allocation should evolve as you age to contain a greater weighting toward bonds and lower weighting toward equities.
Learn more about NEARX and how you might diversify your portfolio with municipal bonds as we approach the late stages of the business cycle.
Please consider carefully a fund’s investment objectives, risks, charges and expenses. For this and other important information, obtain a fund prospectus by visiting www.usfunds.com or by calling 1-800-US-FUNDS (1-800-873-8637). Read it carefully before investing. Foreside Fund Services, LLC, Distributor. U.S. Global Investors is the investment advisor.
Past performance does not guarantee future results.
Bond funds are subject to interest rate risk; their value declines as interest rates rise. Though the Near-Term Tax Free Fund seeks minimal fluctuations in share price, it is subject to the risk that the credit quality of a portfolio holding could decline, as well as risk related to changes in the economic conditions of a state, region or issuer. These risks could cause the fund’s share price to decline. Tax-exempt income is federal income tax free. A portion of this income may be subject to state and local taxes and at times the alternative minimum tax. The Near-Term Tax Free Fund may invest up to 20% of its assets in securities that pay taxable interest. Income or fund distributions attributable to capital gains are usually subject to both state and federal income taxes.
The chart illustrates the performance of a hypothetical $100,000 investment made in the fund during the depicted time frame. Figures include reinvestment of capital gains and dividends, but the perofrmnace does not include the effect of any direct fees described in the fund’s prospectus (e.g. short-term trading fees) which, if applicable, would lower your total returns.
The Barclay’s Capital 3-Year Municipal Bond Index consists of a broad selection of investment grade general obligation and revenue bonds of maturities ranging from one year to four years. The S&P U.S. High Yield Corporate Bond Index is designed to track the performance of U.S. dollar-denominated, high-yield corporate bonds issued by companies whose country of risk use official G-10 currencies, excluding those countries that are members of the United Nations Eastern European Group (EEG). The S&P 500 Investment Grade Corporate Bond Index seeks to measure the performance of U.S. corporate debt issued by constituents in the S&P 500 with an investment-grade rating. The S&P 500 Index is a market-capitalization-weighted index of the 500 largest U.S. publicly traded companies by market value.
The Purchasing Managers’ Index (PMI) is an indicator of economic health for manufacturing and service sectors. The purpose of the PMI is to provide information about current business conditions to company decision makers, analysts and purchasing managers.
A basis point is one hundredth of one percent, used chiefly in expressing differences of interest rates.
All opinions expressed and data provided are subject to change without notice. Some of these opinions may not be appropriate to every investor.


