
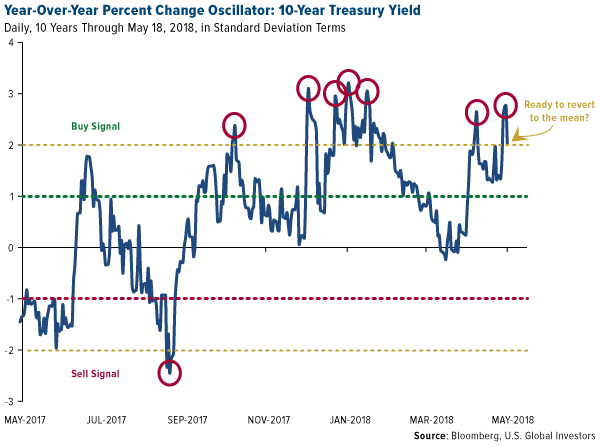
The 10-year Treasury yield has been the topic of conversation lately among fixed-income investors. Earlier this month, the T-note closed above 3 percent for the first time since July 2011, prompting some market watchers to call time on the three-decade Treasury bull market. (Bond prices fall as yields rise, and vice versa.) For other investors, these concerns might extend into the $3.8 trillion municipal bond market.
I believe this bearishness is premature. Take a look at the chart below, which shows the 10-year yield’s daily standard deviation based on 10 years’ worth of data. As of Friday, May 18, the yield was up a little more than two standard deviations from its mean—suggesting that, while not guaranteed, there’s a high probability of mean reversion. Such a move would bring the 10-year yield back down to around 2.88 percent, a level last seen in mid-April. This would be similarly positive for muni bonds, though it’s important to remember that Treasuries, unlike munis, are backed by the full faith and credit of the U.S. government.
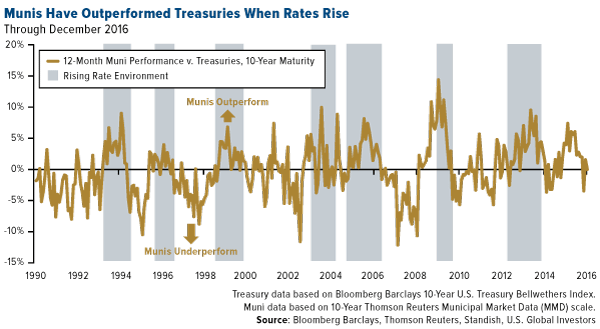
Muni Bonds Outperformed in Previous Rate Hike Cycles
Fixed-income investors might find munis more attractive than Treasuries right now for two additional reasons.
For one, muni bonds historically outperformed and were less volatile than Treasuries during previous rate hike cycles, according to Standish data. In the past, a 100 basis point rise in the 10-year Treasury yield—in response to higher interest rates—was accompanied by a rise of only 60 basis points on average in muni bond yields.
Take a look below. In each of the past seven rate hike cycles, munis outperformed Treasuries by at least 5 percent and sometimes as much as 10 percent or more. The Federal Reserve has raised rates six times since December 2015, with two more increases possibly slated for this year.
Tax Overhaul Favors Munis
Second, because muni bonds are exempt from federal income taxes and often from state and local taxes (SALT) as well, they’re especially attractive to investors living in high-income tax states such as California, New York, New Jersey, Minnesota, Oregon and others.
You might think that the major tax reform bill signed into law at the end of last year would dampen demand for munis. But because the law caps SALT deductions at $10,000, wealthier taxpayers, in many cases, may end up paying more to Uncle Sam than they did before.
Some high-tax states are scrambling to create “SALT workarounds,” designed to help top earners cope with the new tax law and prevent talent from migrating to a state with lower (or no) income taxes.
The problem with these workarounds, though, is that many of them are highly complex. What’s more, filers may run into difficulties with the Internal Revenue Service (IRS), which has expressed disapproval of the workarounds.
You can probably tell where I’m going here. Short-term muni bond funds are a tried-and-true method to help preserve capital and also deliver income that’s tax-free at the federal and often state and local levels.
Interested in learning more about tax-free income? Click here!
All opinions expressed and data provided are subject to change without notice. Some of these opinions may not be appropriate to every investor.
Standard deviation is a measure of the dispersion of a set of data from its mean. The more spread apart the data, the higher the deviation. Standard deviation is also known as historical volatility.
The Bloomberg Barclays 10-Year U.S. Treasury Bellwethers Index is a universe of Treasury bonds, and used as a benchmark against the market for long-term maturity fixed-income securities.
Thomson Reuters Municipal Market Data (MMD) AAA Curve is a proprietary yield curve that provides the offer-side of “AAA” rated state general obligation bonds, as determined by the MMD analyst team. The “AAA” scale (MMD Scale), is published by Municipal Market Data every day at 3:00 p.m. eastern standard time with earlier indications of market movement provided throughout the trading day.
From:: Frank Talk