
There has been quite a bit of chatter about the FANG stocks recently. In fact, the entire Technology Sector has taken a beating over the past 30+ days. Our research team, at Technical Traders Ltd., believes the Technology sector is setting up for a 15%+ price rebound from these recent lows and we want to alert our followers to be prepared for this move.
Let’s start by taking a look at a 1 Month S&P Heat Map showing just how distressed certain sectors are in terms of price valuations. The Brighter Red highlighted symbols represent a price decrease of at least -6.7% to well above -10% over the past 30 days. It is pretty easy to see the entire Technology, Technology Services, Financial, and Consumer Goods sectors are all under some pricing pressure. What interests us is we call the “capital shift” that has been taking place over the past 4+ years.
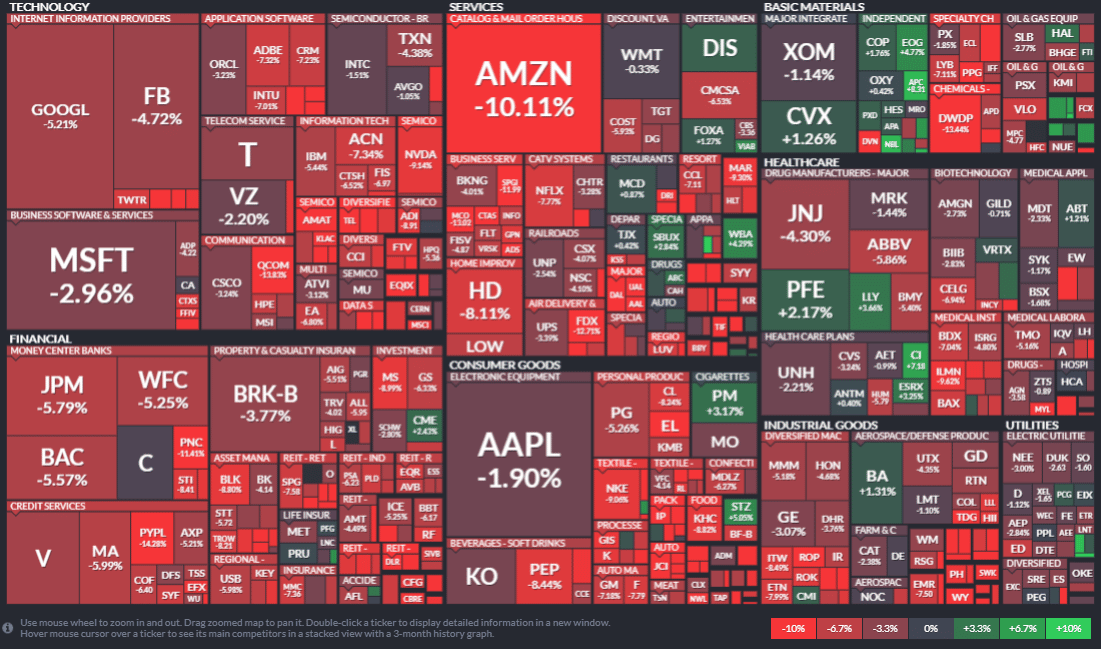
We have authored research posts suggesting that a global capital shift has been taking place on the back of multiple global QE attempts to support the global economies. The premise of our theory is that capital is constantly seeking the safest locations to be deployed with the highest potential for returns. Prior to the US Fed raising interest rates over the past 14+ months, the US Real Estate market was a perfect example of this shift in capital. Additionally, over the past 3+ years, the US Technology sector has been another great example of this shift in capital. As the Emerging Market boob cycle went bust, capital went in search of better targets. As the Oil market went bust, resulting in currency pricing pressures, capital continued to search out the best, most stable, investments and growth opportunities. Our opinion is most of that capital found its way into the US stock market (into technology, biotech, finance, and healthcare).
We believe this capital shift is now under pressure across the globe to identify and execute for longer-term returns and we believe the recent price rotation in the US Equities markets may give this capital further incentive to redeploy into the US Equities market.
Capital MUST find suitable locations for growth, protection, and healthy longer-term returns. One can’t simply keep moving billions of dollars of capital around to various investments every few weeks. Currency concerns are constantly a worry for global investors. Placing your capital into the wrong investment could result in a net loss because currency valuations may destroy your trading profits if you are not cautious. Global concerns regarding the Arab nations, oil production, Asia/China trade/economic issues and the never-ending European Union issues really only leave one location on the planet that is somewhat immune from extended risk – the US Equities market.
Our research team believes this recent price rotation will turn into an excellent buying opportunity for select sectors over the next 60+ days. The trick to being successful with this move is the proper timing of the trades. If you really want to know when is the best time to pull the trigger, then you really want to follow our research and consider joining our other member/subscribers because we provide them with much more detail than is included in these public posts. Still, we believe the charts are screaming at us to consider the longer term “capital shift” that is taking place and to understand the true nature of price – it always seeks out new highs or new lows and capital is always seeking the best returns in the safest environment (away from extreme risk).
Take a look at these charts.
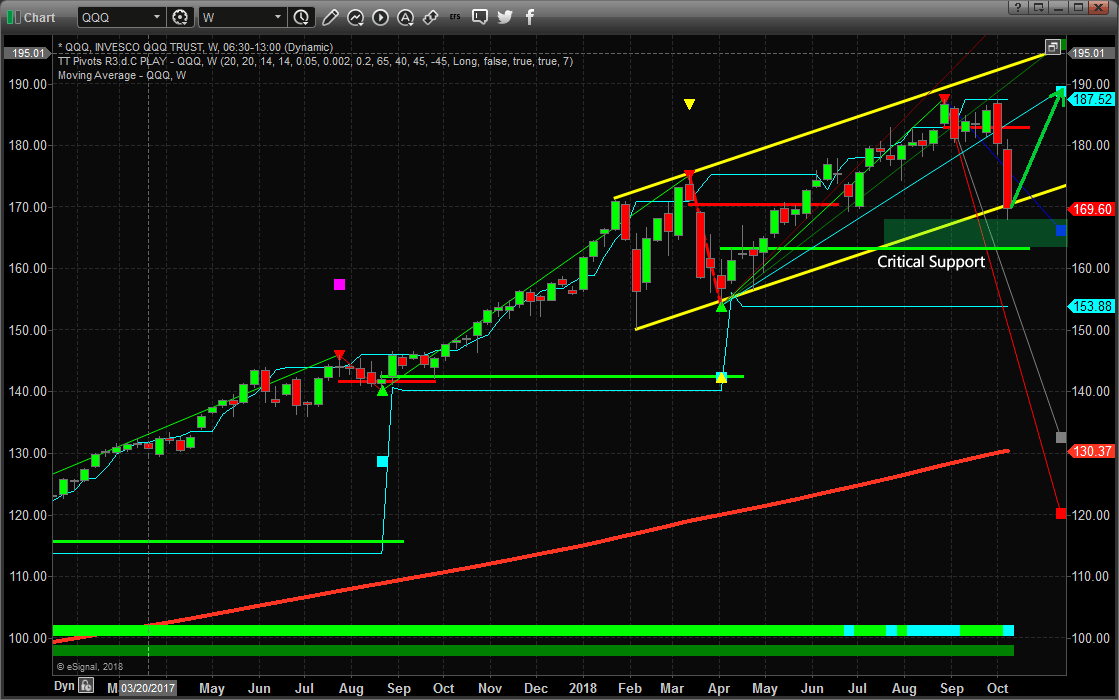
First, the Weekly QQQ. The price channel is clear. The Support level is clear. The lows of February 2018 are the critical price levels that we want to be concerned with. The current price rotation falls to just below the lower YELLOW price channel and stalls. As long as our critical support level is not breached, the QQQ should set up an extended, yet volatile, price bottom before the end of this year and begin to rally back up toward the $190 price level.
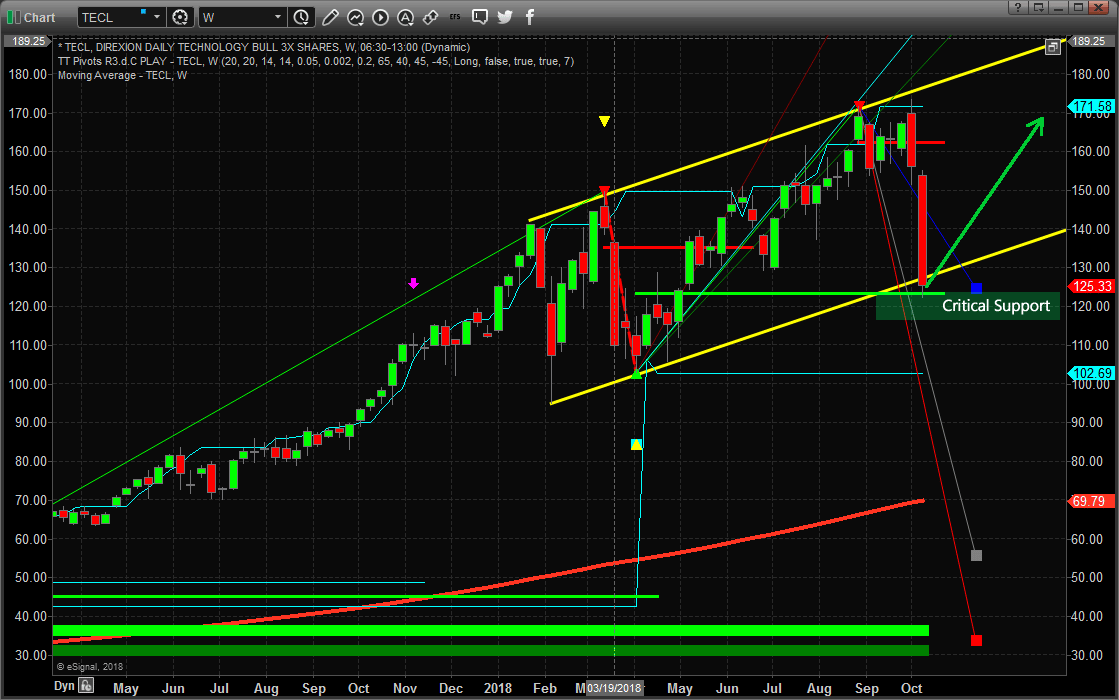
This Weekly TECL chart shows a similar picture to the QQQ chart. The price channels are clear. The Support level is clear. The lows of February 2018 are still acting as “deeper price lows” that indicate we should consider these levels critical to see any major price reversal to the downside. Our critical support level is just below recent price lows, thus we should be expecting the price to stall near this level and the upside price target near $172 is close to $50 away. As long as this support holds and the price continues to hammer out a bottom near or below the $130 level, this rotation could play out for a very nice 20~30% upside price move.
We are not urging our followers to BUY anything just yet. Certainly, be aware of the potential for an upside move as this price bottom plays out over time. Use your own skills to find and execute proper trades or visit www.TheTechnicalTraders.com to learn our team of professionals can assist you.
Our proprietary price modeling systems will tell us exactly when and how to enter these trades and we want our followers to understand the type of rotation that we believe is currently playing out in the markets. We believe this recent move to the downside was the result of very mild volatility prior to this move, computerized trading models setting large sell orders near the 2715 price level on the S&P in preparation for just this type of move. Once the price reacted to the US Fed, general price rotation and selling pressure and fell below 2715, the sell programs kicked in and drove the price down to levels near support. So far, prices have not attempted to move much lower and that is a very good sign for the current trend channels and upside price trend. Watch how this plays out and get ready for some great trades over the next 6+ months.
Please take a moment to visit www.TheTechnicalTraders.com to see how we can help you find and execute better trades. Our team of researchers and technical traders follow these markets every day to try to find and understand the dynamics at play globally. Take a minute to read how we predicted this downward market move 3+ weeks before it happened with our predictive modeling systems. If you don’t think it is possible to know what the markets are going to do weeks in advance, then take a minute to review our work and see for yourself how we predicted this move to the 2700 level in the S&P. Now, get ready for some great trades that will be setting up over the next 4+ months. Q3 and Q4 of 2018 are going to set up some really big opportunities for skilled traders.
Chris Vermeulen