
It finally happened!
The CFTC (Commodity Futures Trading Commission) reported (9/4/18) that for the first time in 17 years commercial participants in gold futures flipped their COMEX positioning to net long.
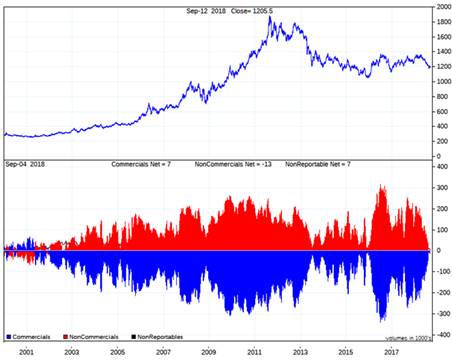
As shown in Figure 1, this does not mean commercial activity boasts infallible predictive value. Throughout gold’s two-year advance to September 2011 highs, for example, commercials-maintained record short exposures. Such is the nature of the predominantly hedging role played by commercial players in gold markets. However, at least since the waning months of gold’s 20-year bear market which ended in 2001, on each occasion commercials have abandoned their hedging posture almost entirely, strength in the gold price has proved imminent.
Figure 1: Top – Spot Gold (1/1/00-9/12/18) | Bottom – COMEX Gold Futures Positioning (1/1/00-9/4/18)
Red Bars = Large Speculators | Blue Bars = Commercials
Source: Ned Laird; Sharelynx
In the zero-sum framework of COMEX contracts, gold commercials have achieved their rare net-long position by absorbing an onslaught of fresh shorts from the speculator community, in the process, choosing collectively to retire their own short posture. As we outlined in our August report (Summer Test) specs have built an (equally rare) net-short position by way of a literal explosion in their gross shorts, which quadrupled from 55,678 contracts on 3/27/18 (and a post-2001 average of 57,000 contracts) to an 8/21/18 peak of 222,210 contracts.
Figure 2 demonstrates that the 8/21/18 peak in spec shorts was not only a new all-time high, but it also exceeded the prior 2015 record by 40%. While we recognize anything is possible, it seems improbable that hedge-fund specs are about to pick-off the entire commercial community with such an unprecedented bearish bet.
Stay tuned!
Figure 2: Gold Large Spec Gross Short Positions COMEX (9/18/07-9/4/18)
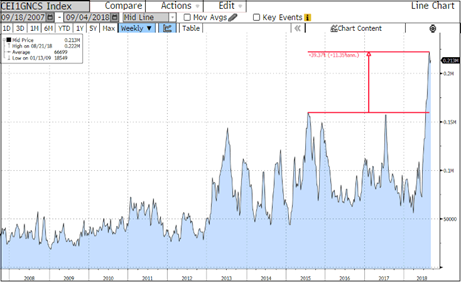
Source: Bloomberg
Strong US dollar continues to dampen precious metals
The mid-2018 decline in precious metals sentiment has clearly run hand-in-hand with rekindled enthusiasm for the U.S. dollar. As we mentioned in August, the DSI1 sentiment reading for the U.S. dollar touched 96% bullish on 8/14/18, eclipsing all but five days in the Index’s 7,966-trading-day-history.
What has been the predictive value of recent extremes in DSI dollar sentiment and COMEX gold positioning? Well, on the dollar side of the equation, not much! In fact, the 9/13/18 close for the DXY Dollar Index2 of 94.52 was statistically flat with its 94.42 close some 3½ months earlier on 5/28/18. Come to think of it, as shown in Figure 3, the DXY’s 9/13/18 close was also flat with its 94.31 close 14 months earlier on 7/20/17, not to mention the fact that the DXY is still down a steep 9.0% from its 1/3/17 high of 103.82!
With all due respect to U.S. dollar bulls, can the dollar’s recent performance really be characterized as “strong,” given the 255 basis point premium of 10-year Treasuries over German bunds (9/13/18), the hawkish tenor of Fed jawboning, and YTD emerging markets (EM) currency collapses in Argentina (52%), Turkey (38%), Brazil (20%), South Africa (16%) and Russia (15%)? No market sentiment of the past several years has been more of a straw hat than U.S. dollar bullishness. Sorry folks, but it just hasn’t happened.
Figure 3: DXY U.S. Dollar Index (9/14/15-9/14/18)
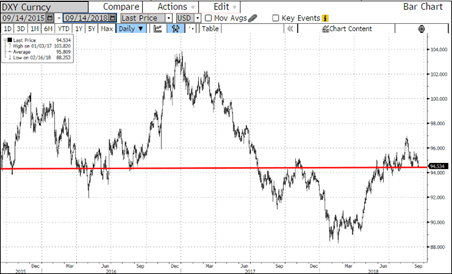
Source: Bloomberg.
Gold continues to battle challenging fundamentals
On the gold side of the mix, we would suggest the jury is also still out. In reflexive similarity to the U.S. dollar, gold has faced a recent spate of challenging fundamentals, such as fresh highs for equity averages, hawkish Fed jawboning, perky 10-year U.S. Treasury yields and the never-ending strong-dollar narrative.
We suspect that the spec funds now short 21 million ounces of gold are scratching their heads as to why spot gold has not declined any further than $1,201.49 (9/13/18). Indeed, it increasingly appears that gold’s mid-April through mid-August swoon (Figure 4) may have been precipitated at least in part by the very same hedge-fund shorting quantified in Figure 2 and memorialized by purple circles in Figure 4. What are spec shorts going to do for an encore?
Figure 4: Spot Gold (9/13/16-9/13/18)
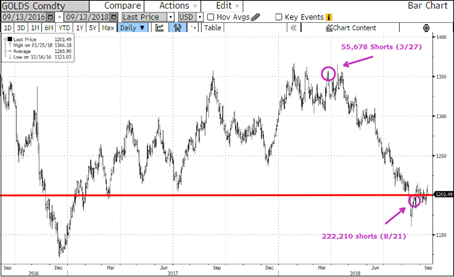
Source: Bloomberg.
Gold’s $1,200 floor
Since early 2017, $1,200 has served as an effective floor for spot gold (red line in Figure 4). Indeed, ever since mid-2013, $1,200 appears to have been a line in the sand below which gold’s prominent physical markets begin draining western sellers (in the case of India, after adding roughly $150 of import duties to the prevailing global spot price). Without delving too deeply into paper-versus-physical dynamics of gold markets, suffice it to say that western investors are woefully uninformed about the economic and cultural status of physical gold around the globe. Especially in the United States, investors typically scoff at the suggestion that gold equates to real money. Contrary to U.S. consensus, however, there are billions of people around the world who actually view gold as preferred money.
Briefly, the World Gold Council (WGC) estimates that 2017 supply and demand for physical gold balanced around 4,400 metric tons (tonnes) with global mine production totaling 3,305 tonnes. Of the 4,400-tonne total, WGC calculates that global consumer demand measured 3,224 tonnes or 72% of global demand and 98% of global mine production. China and India together accounted for fully 55% of total consumer demand (1,776 tonnes). By comparison, U.S. consumer demand totaled a mere 160 tonnes in 2017, or less than 5% of the global total.
Now here’s the fun fact. Despite negligible U.S. participation in physical gold markets, COMEX traded 73 million papergold contracts in 2017, equivalent to 227,053 tonnes of gold, or roughly 70 times global mine production. Why are these statistics of interest? Because any economy, market or society representing less than 5% of physical consumption of any product or commodity, which simultaneously traffics paper claims measuring 7,000% of that product’s global production is prone to missing a few subtleties about that product’s true supply/demand characteristics.
Figure 5 offers the 2018 vintage of bearish COMEX …read more
From:: Mining.com